Soybean Update
Soybeans range from VE (emergence) to the fourth trifoliate leaf stage. The majority of the crop was planted in May, although sporadic showers meant that some could not be planted until June. A few soybeans were planted in April. They are now at the fifth trifoliate leaf stage. Ideally, soybeans should have 6 trifoliates by the time they begin to flower to maximize yield potential.
What is the Critical Weed Free Period?
Soybeans are susceptible to yield losses from weed competition, especially when they are small. The critical weed free period is the time during the growing season when uncontrolled weeds cause the greatest yield loss. Yield losses from the presence of living weeds during this time are irreversible. This makes early season weed control essential.
There are several factors that dictate the exact length of the critical weed free period, such as weed density, weed species, and when the weeds emerge. It’s well documented that if weeds are not controlled by the first trifoliate, yields will decline rapidly each day they are not sprayed. Studies have shown that beginning from the first trifoliate, uncontrolled weeds can reduce yield by 0.5 to 2 bu per acre per day. The first trifoliate to the third trifoliate growth stage is considered the “critical weed free period” since the presence of weeds during this time causes the highest yield losses. In wide rows or low plant populations, the weed free period is slightly longer.
The best strategy to reduce yield losses is to always start with a clean field at planting, either through tillage or an herbicide application. It’s important to know that weeds that emerge at the same time as the crop cause the greatest amount of competition and yield reduction, which is partly why many growers use a soil applied residual herbicide in addition to Roundup. Later emerging weeds have less of an impact on final yield. As a rule of thumb, the first in crop application should be made approximately 21-28 days after seeding.
Is it Too Late to Apply Potash?
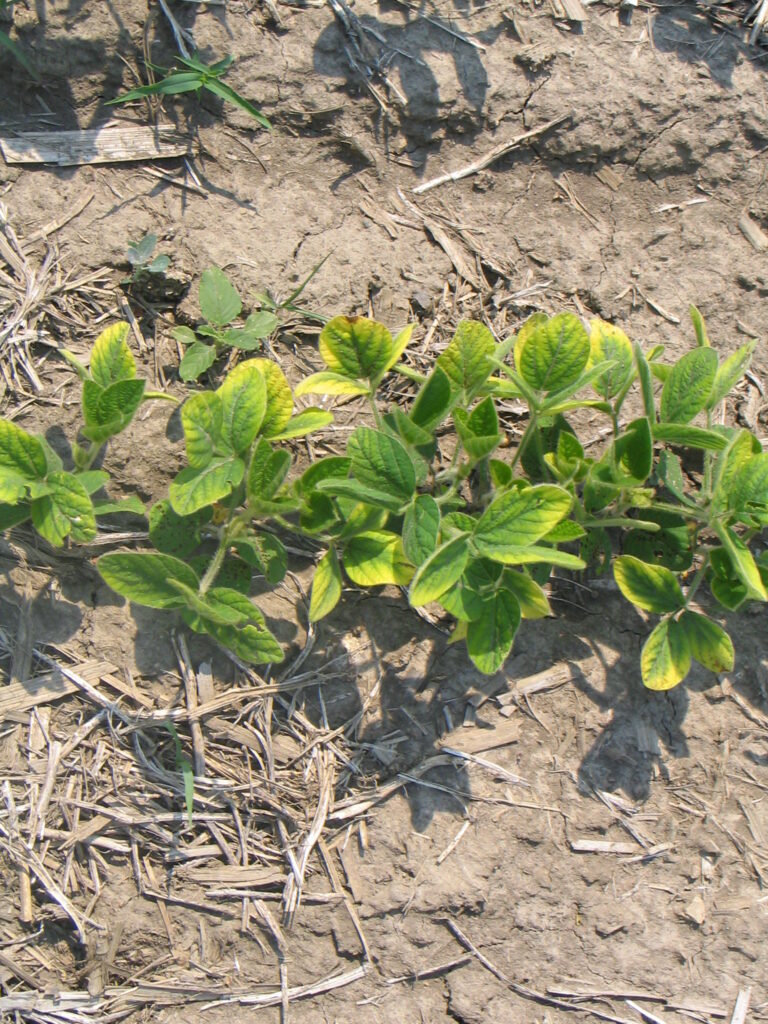
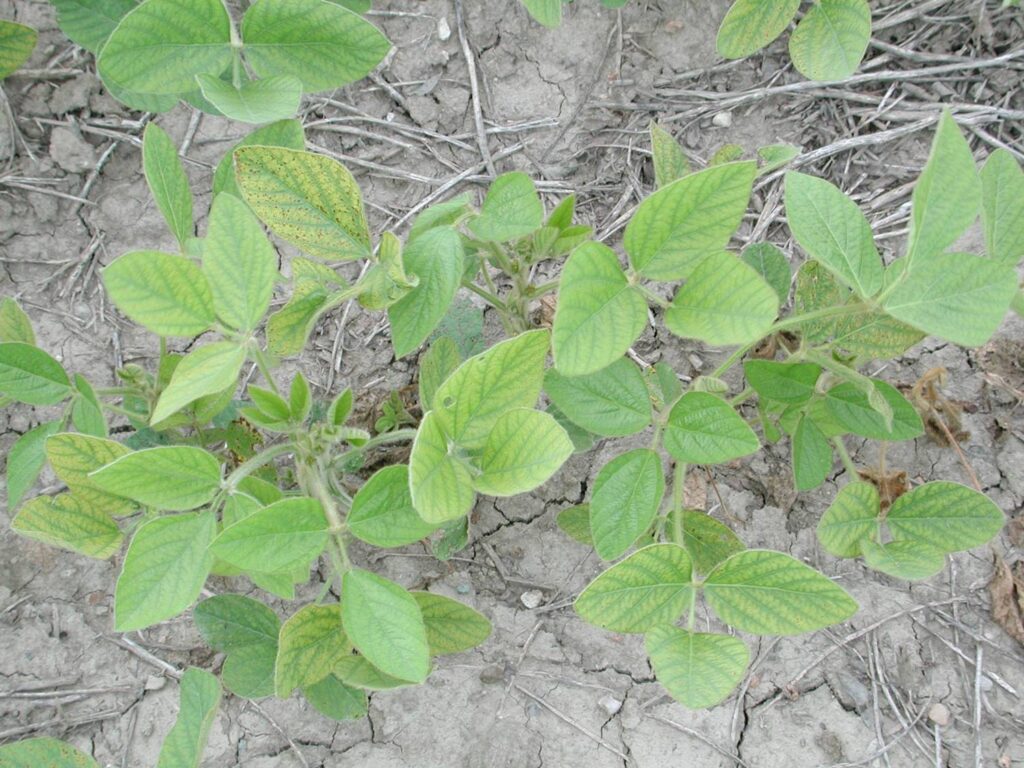
Potassuim (K) and Manganese (Mn) deficiency are already evident this year. These two nutrient deficiencies have unique leaf symptoms. K deficient leaves turn yellow along the leaf margins (see Figure 1.), while Mn deficient leaves turn yellow across the whole leaf, except for the veins which remain green (see Figure 2.).
A soil test is the only reliable way to know if a field is truly low in K or if the plants are just showing stress-induced potassium deficiencies. K deficiency symptoms may also indicate soybean cyst nematode (SCN) feeding on the roots. If the soil test is poor for K (less than 100 ppm) a broadcast application at this time is still warranted as a remedial management strategy. Soybeans are very responsive to potash and have the ability to utilize surface applied potash even after planting.
Manganese Deficiency
One of the most significant factors affecting the availability of Mn is the soil pH. As soil pH increases, less Mn is available to the plant. The deficiency is most common on poorly drained soils, especially clays. The amount of air in the soil also impacts available Mn, so tire tracks often show less Mn deficiency. High organic matter also ties up Mn. Since Mn is a micronutrient, a foliar application of Mn works well to rectify the deficiency and can provide a 5+ yield response.
Replants
Many soybean fields are struggling this year to achieve a perfect stand. Keeping an existing stand is often more profitable than replanting at this date. The uniformity of the existing crop is more important than having a high population. Soybeans have an impressive ability to compensate for thin stands under good growing conditions. Soybean plants can fill spaces up to 30 cm (12 inches) within or between rows with relatively little yield reduction. Research has shown that a final stand of 90 000 plants per acre in 7.5-inch rows provides a yield potential of 90%. Plants must be healthy, evenly distributed and weed free for low populations to flourish. Field experience has shown that more plants per acre are needed on clay soils. A minimum stand of about 110 000 plants/acre on heavy clay soils is required to achieve good yields. When thickening a poor stand, use the same variety. These later planted seeds will mature within 10 days of the original stand even though they may have been seeded a month later in the spring.
Weather Data – June 6 – 12, 2022
| Location | Year | Highest Temp (°C) | Lowest Temp (°C) | Rain (mm) | Rain (mm) April 1st | GDD 0C April 1st | GDD 5C April 1st | CHU May 1st |
| Harrow | 2022 | 27.4 | 11.4 | 33.1 | 189 | 924 | 592 | 844 |
| | 2021 | 29.8 | 12.8 | 6.3 | 130 | 956 | 610 | 772 |
| | 10 YR Avg. (2011-20) | 25.9 | 12.1 | 15.7 | 218 | 923 | 561 | 822 |
| Ridgetown | 2022 | 25.9 | 9.3 | 42.1 | 170 | 859 | 534 | 765 |
| | 2021 | 29.2 | 11.1 | 7.1 | 122 | 897 | 559 | 740 |
| | 10 YR Avg. (2011-20) | 25.6 | 11.0 | 9.1 | 188 | 855 | 497 | 755 |
| London | 2022 | 24.5 | 8.1 | 30.2 | 181 | 833 | 513 | 733 |
| | 2021 | 30.4 | 12.6 | 7.8 | 127 | 898 | 565 | 717 |
| | 10 YR Avg. (2011-20) | 25.2 | 10.3 | 18.6 | 208 | 837 | 483 | 742 |
| Brantford | 2022 | 25.0 | 7.8 | 31.5 | 161 | 827 | 501 | 706 |
| | 2021 | 31.8 | 13.4 | 4.8 | 120 | 872 | 538 | 702 |
| Welland | 2022 | 26.2 | 10.1 | 41.0 | 186 | 876 | 540 | 758 |
| | 2021 | 29.7 | 14.5 | 3.0 | 85 | 866 | 527 | 686 |
| | 10 YR Avg. (2011-20) | 25.0 | 9.8 | 20.8 | 216 | 838 | 483 | 736 |
| Elora | 2022 | 23.9 | 7.9 | 38.3 | 163 | 761 | 448 | 648 |
| | 2021 | 31.3 | 12.3 | 3.3 | 97 | 793 | 468 | 628 |
| | 10 YR Avg. (2011-20) | 24.0 | 8.7 | 20.4 | 208 | 731 | 390 | 637 |
| Mount Forest | 2022 | 23.7 | 8.3 | 46.3 | 179 | 768 | 461 | 672 |
| | 2021 | 30.4 | 12.0 | 2.7 | 100 | 806 | 483 | 643 |
| | 10 YR Avg. (2011-20) | 24.2 | 8.7 | 22.4 | 193 | 716 | 383 | 631 |
| Peterborough | 2022 | 22.9 | 6.9 | 80.6 | 199 | 769 | 441 | 672 |
| | 2021 | 30.6 | 8.6 | 1.0 | 91 | 784 | 448 | 622 |
| | 10 YR Avg. (2011-20) | 24.7 | 7.8 | 26.2 | 201 | 744 | 403 | 652 |
| Kemptville | 2022 | 24.0 | 7.3 | 29.2 | 271 | 845 | 497 | 741 |
| | 2021 | 32.0 | 9.6 | 0.6 | 98 | 888 | 545 | 693 |
| | 10 YR Avg. (2011-20) | 24.9 | 9.3 | 25.0 | 204 | 779 | 439 | 690 |
| Earlton | 2022 | 23.7 | 6.2 | 30.5 | 144 | 660 | 381 | 632 |
| | 2021 | 33.7 | 5.2 | 1.2 | 79 | 744 | 428 | 584 |
| | 10 YR Avg. (2011-20) | 23.4 | 6.2 | 15.7 | 162 | 543 | 286 | 516 |
| Sudbury | 2022 | 23.1 | 7.9 | 46.2 | 184 | 658 | 371 | 604 |
| | 2021 | 31.6 | 9.7 | 23.2 | 120 | 743 | 428 | 586 |
| | 10 YR Avg. (2011-20) | 23.2 | 8.0 | 12.7 | 185 | 601 | 322 | 557 |
| Thunder Bay | 2022 | 25.1 | 3.1 | 4.3 | 302 | 482 | 231 | 427 |
| | 2021 | 31.5 | 4.1 | 29.8 | 185 | 615 | 312 | 511 |
| | 10 YR Avg. (2011-20) | 22.3 | 5.2 | 12.7 | 164 | 491 | 222 | 426 |
| Fort Frances | 2022 | 24.1 | 2.4 | 2.9 | 301 | 516 | 267 | 492 |
| | 2021 | 32.1 | 3.9 | 30.8 | 142 | 684 | 375 | 614 |
| | 10 YR Avg. (2011-20) | 24.0 | 6.3 | 29.6 | 162 | 575 | 289 | 525 |
One thought on “Crop Report – June 15, 2022”
Comments are closed.