Spring Roundup
As we close out the 2022 spring planting window, for the most part we see crops in good shape, but as always, there are regional differences.
Alfalfa in western and southwestern Ontario suffered a great deal of die out this winter. Farmers had to make quick plans to address this issue. Alternatively, alfalfa and winter wheat in eastern Ontario weathered the winter better than normal and producers there are pleased with these crops. Frequent rains in the east, northwest, and Algoma district are challenging dry hay harvest.
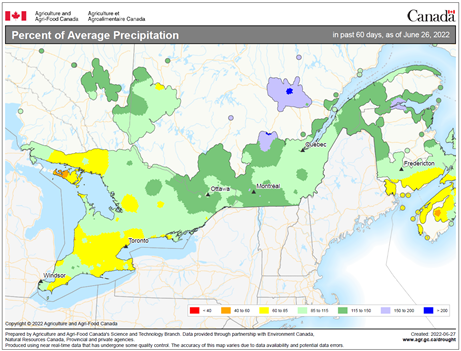
The early spring wet period kept most out of the fields in late April and early May. While the rainfall rates were for the most part not excessive, we didn’t get typical spring sunny warm days to dry out the soil and the frequent small showers continued to slow down the drying process (Figure 1.). As well in many places’ soils were still saturated into spring from the excessively wet fall of 2021. These factors led to a condensed planting window for our major row crops. Eastern Ontario especially received more than average rainfall making for additional unwanted stress. The pressure at edible bean planting time had diminished but farmers were finding some dry soil conditions they had to contend with. This added extra pressure to the retail input suppliers and farmers to keep ground preparation going, planters rolling, and sprayers struggling to keep up.
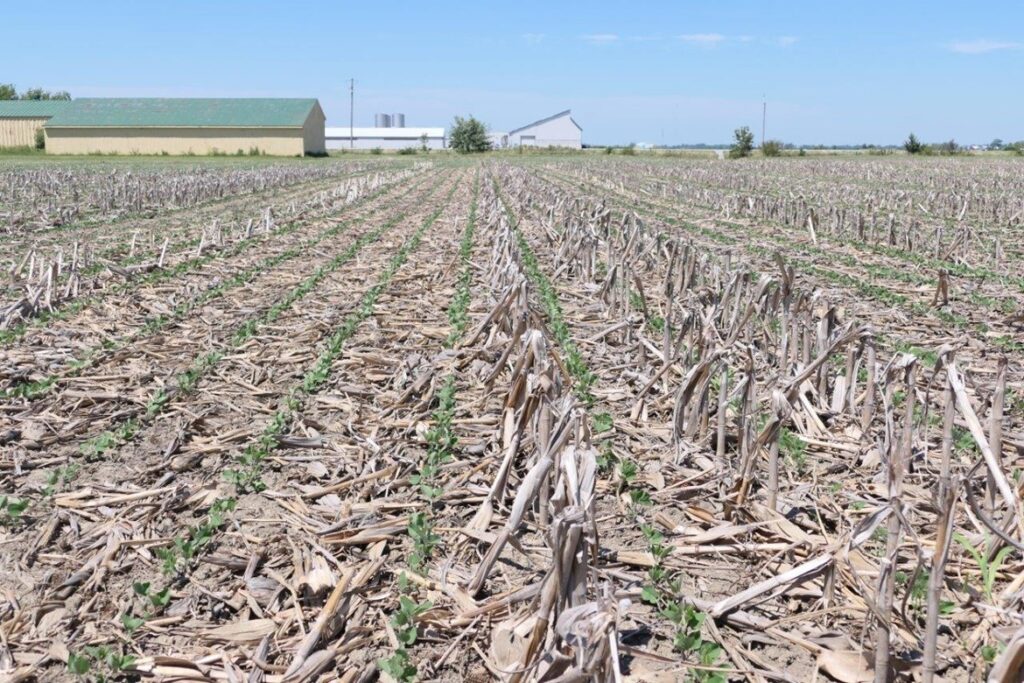
In general, the soil conditions have been excellent for seeding this spring when we finally got to them, we are now seeing evidence of compaction in areas created by starting in the fields when the soils were not quite” fit”. In many places soils were dry in the top ½” but saturated below. Working this ground too early leads to smearing and can cause problems with and following planting. With large planters and equipment, the number of acres that can be covered in short order means a “too early start” can impact a lot of acres. Additionally, the wet period was followed by a dry period and some producers over worked ground which made finding moisture at planting depth problematic. Those on heavy clay soils across various regions of the province had significant struggles in planting in a timely way into fit soils (Figure 2).
This past week with the heat, “pineapple” corn and rolled soybean leaves have been seen in both lighter and heavier soils. Moisture is needed to keep the good potential for yield on track. With the heat and where soil moisture is adequate, we are entering the elongation phase of corn growth leading to mid to late July tasselling depending on location. In soybeans, much of the crop is starting to flower. The heat has brought on rapid colour change in winter wheat as it heads toward grain fill and maturity.
With the condensed spring season, a significant acreage of intended T3 fungicide was not applied or applied late. Fusarium is showing up in fields in the southwest that are well advanced. Farmers should scout their fields to determine the level of fusarium damage and plan to harvest accordingly to ensure quality of the best portion of the crop.
Winds this spring never seemed to let up making the spraying job that much harder. Everyone needs to consider the risks of spraying under windy conditions which can lead to off target drift and injury to other crops/plants and reduces the efficacy of the products at their intended targets.
Weed control has been a struggle and it is important to scout fields as we enter summer. Are there weed escapes that need attention before we run out of time to address them? Are there weeds coming because of the weather conditions or maybe herbicide resistance? Its important to identify that now so you can prepare plans to address any resistance through your weed control choices in the coming fall and spring. Resistance should be checked by collecting seed of some of the escapes and submitting them according to the information at https://www.plant.uoguelph.ca/resistant-weeds.
If you are going to retreat weed escapes it is important to gather plants/seeds according to the instructions at the URL link above before treatment. Live plants that can set seed are needed to test for herbicide resistance. Resistance testing is important since many species are showing multi mode of action resistance. Not knowing the extent of resistance inhibits your ability to plan the best weed control program in future. A lot of time and dollars are invested in the 2022 crops currently growing. It is vitally important to preserve that yield potential by scouting those fields and addressing problems that can be fixed before we run out of management options available to the 2022 crop.
Weather Data – June 20-26, 2022
| Location | Year | Highest Temp (°C) | Lowest Temp (°C) | Rain (mm) | Rain (mm) April 1st | GDD 0C April 1st | GDD 5C April 1st | CHU May 1st |
| Harrow | 2022 | 33.7 | 13.3 | 3.4 | 208 | 1237 | 835 | 1216 |
| | 2021 | 30.0 | 7.8 | 89.6 | 232 | 1238 | 822 | 1119 |
| | 10 YR Avg. (2011-20) | 26.8 | 15.1 | 26.8 | 264 | 1213 | 781 | 1184 |
| Ridgetown | 2022 | 33.0 | 9.8 | 0.5 | 174 | 1151 | 756 | 1106 |
| | 2021 | 29.7 | 6.1 | 98.2 | 233 | 1159 | 751 | 1057 |
| | 10 YR Avg. (2011-20) | 26.3 | 13.6 | 15.1 | 223 | 1129 | 702 | 1094 |
| London | 2022 | 32.5 | 9.8 | 0.3 | 181 | 1119 | 729 | 1069 |
| | 2021 | 28.2 | 7.5 | 66.2 | 201 | 1154 | 750 | 1026 |
| | 10 YR Avg. (2011-20) | 26.1 | 13.8 | 28.6 | 252 | 1110 | 686 | 1077 |
| Brantford | 2022 | 34.2 | 8.5 | 6.6 | 176 | 1115 | 719 | 1034 |
| | 2021 | 29.9 | 7.0 | 60.3 | 183 | 1138 | 733 | 1015 |
| Welland | 2022 | 30.8 | 12.7 | 1.0 | 190 | 1158 | 753 | 1101 |
| | 2021 | 27.8 | 7.3 | 29.6 | 122 | 1127 | 719 | 1002 |
| | 10 YR Avg. (2011-20) | 26.2 | 13.9 | 19.8 | 248 | 1111 | 686 | 1072 |
| Elora | 2022 | 32.6 | 8.0 | 0.0 | 163 | 1024 | 641 | 950 |
| | 2021 | 27.0 | 4.8 | 42.0 | 161 | 1035 | 639 | 914 |
| | 10 YR Avg. (2011-20) | 25.1 | 12.2 | 25.1 | 247 | 981 | 571 | 941 |
| Mount Forest | 2022 | 31.5 | 8.0 | 0.7 | 179 | 1028 | 651 | 974 |
| | 2021 | 27.1 | 6.2 | 38.5 | 140 | 1045 | 652 | 926 |
| | 10 YR Avg. (2011-20) | 24.8 | 12.6 | 38.3 | 249 | 964 | 561 | 933 |
| Peterborough | 2022 | 31.4 | 10.0 | 0.4 | 212 | 1033 | 635 | 979 |
| | 2021 | 27.6 | 2.3 | 23.2 | 129 | 1025 | 618 | 906 |
| | 10 YR Avg. (2011-20) | 25.8 | 10.8 | 19.4 | 236 | 993 | 582 | 948 |
| Kemptville | 2022 | 30.7 | 7.6 | 28.8 | 301 | 1106 | 689 | 1047 |
| | 2021 | 28.9 | 4.9 | 25.8 | 168 | 1140 | 728 | 991 |
| | 10 YR Avg. (2011-20) | 26.3 | 12.4 | 19.3 | 236 | 1040 | 630 | 1005 |
| Earlton | 2022 | 29.1 | 10.4 | 18.7 | 180 | 912 | 564 | 927 |
| | 2021 | 25.3 | 3.8 | 82.3 | 166 | 967 | 580 | 837 |
| | 10 YR Avg. (2011-20) | 24.8 | 9.4 | 21.9 | 202 | 772 | 446 | 786 |
| Sudbury | 2022 | 27.6 | 10.9 | 1.5 | 189 | 905 | 547 | 897 |
| | 2021 | 23.6 | 1.8 | 42.6 | 178 | 965 | 580 | 846 |
| | 10 YR Avg. (2011-20) | 24.9 | 10.7 | 23.0 | 221 | 842 | 493 | 846 |
| Thunder Bay | 2022 | 33.9 | 8.7 | 4.9 | 340 | 706 | 385 | 671 |
| | 2021 | 26.9 | 4.6 | 12.1 | 197 | 840 | 467 | 763 |
| | 10 YR Avg. (2011-20) | 24.4 | 7.7 | 28.8 | 214 | 700 | 361 | 664 |
| Fort Frances | 2022 | 34.6 | 4.7 | 44.0 | 373 | 774 | 456 | 792 |
| | 2021 | 29.0 | 0.3 | 8.6 | 154 | 904 | 526 | 864 |
| | 10 YR Avg. (2011-20) | 25.1 | 9.2 | 22.7 | 212 | 808 | 451 | 802 |
.
2 thoughts on “Ontario Field Crop Report – June 29, 2022”
Comments are closed.