Spring canola across the province is currently at or beyond full bloom. Observations from around the province at this stage are that spring canola is looking better overall than it has in recent years, particularly in Timiskaming District where the majority of the crop is grown. Little to no swede midge damage was observed in Timiskaming District prior to bolting.
Winter canola harvest has begun in southern regions. Many winter canola fields were terminated in late spring because of poor overwinter survival while some were retained but with lower yield expectations. However, with high prices the winter crop is proving profitable and there are certainly fields that promise to have strong yields.
Spring Canola
Fungicide application for white mould prevention has a strong return on investment in canola (both winter and spring types) because wet and humid conditions persist within the dense canopy, even in warm and sunny conditions. White mould spores colonize flower tissue, and the disease enters other healthy plant tissues when infected flower petals land on leaves or stems. Most spring canola is now beyond the 50% bloom stage, so the window to apply fungicide has closed. Significant flower petal drop has already occurred at 50% bloom, and white mould infection at later growth stages is less likely to cause significant yield loss. Fungicide applications beyond 50% bloom are also off-label, and this application timing may be within the pre-harvest interval.
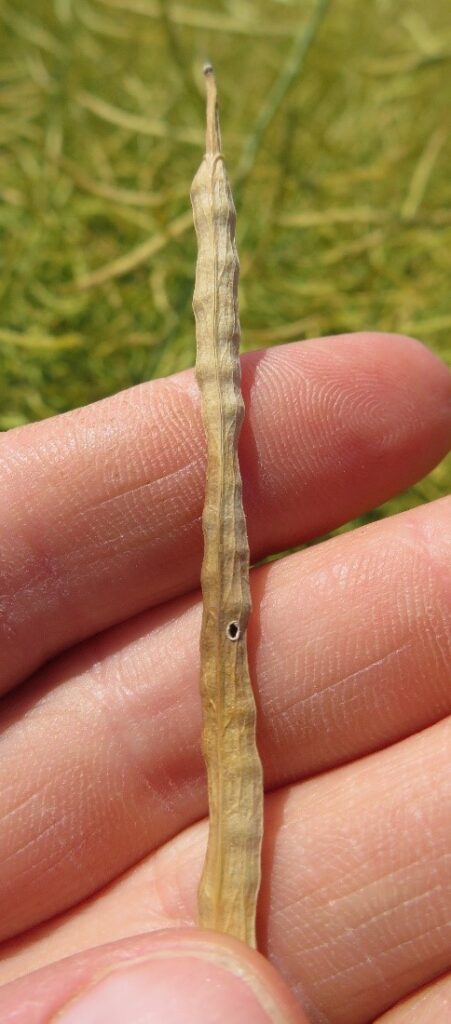
Beyond 50% bloom, there usually are no management interventions until harvest time. It is very difficult to walk in canola fields during pod fill, but during late bloom stages and early pod fill it may be beneficial to check for insects. Late infections of cabbage seedpod weevil can result in holes chewed in pods (Figure 1.) which will increase the risk of shatter losses towards the end of the season. Being aware of holes in pods can inform harvest management decisions, including which fields to prioritize for prompt harvesting.
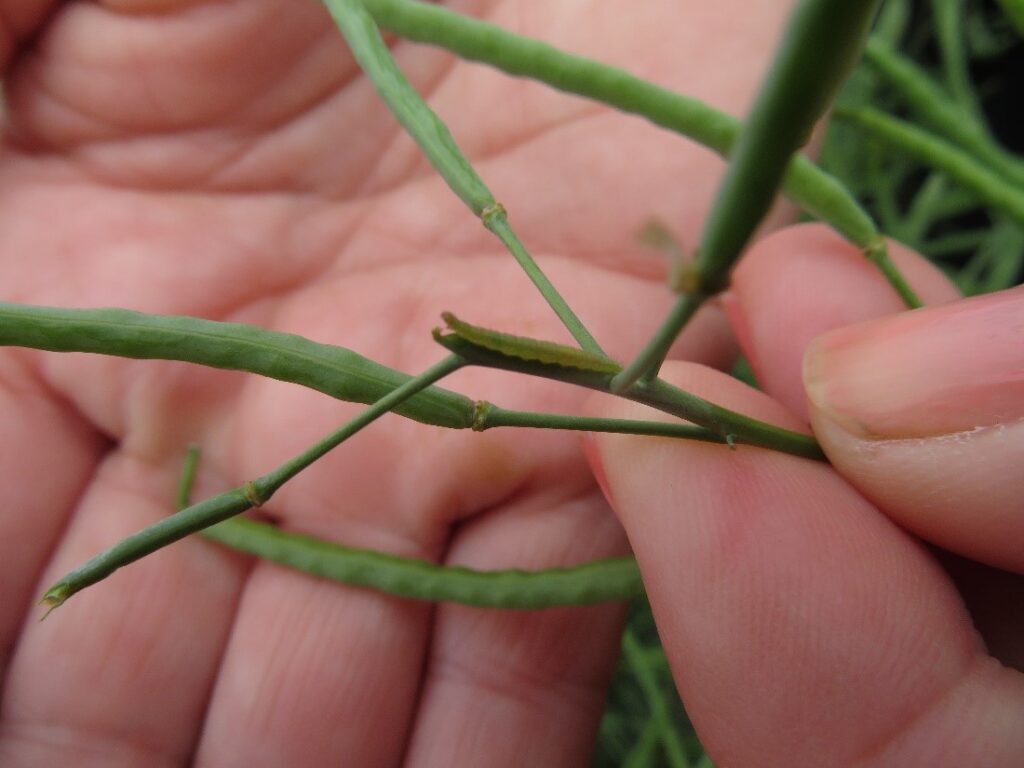
Diamondback moth larvae (Figure 2.) are another pest to watch. In late June, some fields in Timiskaming District were observed to have diamondback moth larvae present, but not at threshold levels. The larvae will feed on the exterior of pods when leaf tissue senesces, or when there is less leaf tissue due to plant stress or lack of moisture. It is difficult to effectively scout for this pest and determine if it is at threshold. The threshold is 200-300 larvae per square meter. One method is to count all the larvae on plants within a square foot, also counting any that fall to the ground. It may help to squish them as you count them. Then multiply the number of larvae by 10 to get the number per square meter. This method simplifies scouting somewhat but is not supported by all entomologists. A sweep net cannot be used to accurately scout for this pest. The Canola Watch article “Diamondback moth larvae: Common questions” can be consulted for more information.
Winter Canola
Harvest has begun on some fields in Essex and Chatham-Kent counties but is 2 or 3 weeks away in regions further north. Crops that were less healthy coming out of winter may have advanced more quickly through to maturity. Canola will dry down naturally in time, and pre-harvest herbicides are not required. Where fields are patchy and weed pressure is high, there may be value in applying a herbicide to control weeds. Herbicide applications have the added benefit of drying down plant stems faster than natural drying, but they will not speed the time to full seed colour change and maturity. Pre-harvest herbicide use may bring more value where there is an intention to plant double-crop soybeans.
Pre-harvest herbicide options include glyphosate, glyphosate plus Eragon, or Reglone. Herbicide application will help dry down plant stems, increasing ease of harvest, but note that where plant stems are very thick because of low populations or seeding on wide rows there could still be green in the stems at harvest. Reglone must have Agral 90 included in the tank. It is a true desiccant and is faster acting than the other options. There is a risk of shatter loss if there are harvest delays after Reglone application, especially if there is adverse weather such as hail, and heavy rain or wind. Performance of Reglone will be best if you spray in the evening allowing the plant to take up the herbicide, prior to a warm, sunny day. It should be applied when 80-90% of seeds have turned from green to brown-black.
Glyphosate and glyphosate plus Eragon are slower acting; harvest may be 2 or 3 weeks after application. Merge is required where Eragon is used. Eragon tends to work best when applied during warm, sunny days. These products are applied when 65-75% of seeds have turned from green to brown-black.
Canola must be delivered to end users at 10% seed moisture or below. On a hot, sunny day, moisture can drop a couple percent through the day, so it may be possible to start harvest around 11% or 12% moisture. Canola must also be delivered with less than 2% green seed. The first seeds to change colour are at the bottom of the main stem. The last seeds to change colour are at the tips of the secondary branches.
Weather Data – July 4 – 10 2022
| Location | Year | Highest Temp (°C) | Lowest Temp (°C) | Rain (mm) | Rain (mm) April 1st | GDD 0C April 1st | GDD 5C April 1st | CHU May 1st |
| Harrow | 2022 | 31.4 | 17.4 | 7.5 | 217 | 1438 | 990 | 1459 |
| | 2021 | 32.6 | 11.8 | 11.2 | 253 | 1559 | 1072 | 1514 |
| | 10 YR Avg. (2011-20) | 28.6 | 16.5 | 36.2 | 327 | 1527 | 1025 | 1576 |
| Ridgetown | 2022 | 30.5 | 16.4 | 4.3 | 181 | 1342 | 902 | 1333 |
| | 2021 | 31.9 | 8.7 | 32.4 | 272 | 1464 | 986 | 1424 |
| | 10 YR Avg. (2011-20) | 29.4 | 14.3 | 25.6 | 266 | 1431 | 934 | 1462 |
| London | 2022 | 28.9 | 13.4 | 7.6 | 198 | 1295 | 860 | 1277 |
| | 2021 | 31.1 | 13.5 | 27.0 | 240 | 1457 | 983 | 1398 |
| | 10 YR Avg. (2011-20) | 29.1 | 14.6 | 25.0 | 292 | 1408 | 915 | 1442 |
| Brantford | 2022 | 29.4 | 11.7 | 6.8 | 187 | 1292 | 851 | 1239 |
| | 2021 | 30.6 | 13.4 | 20.0 | 225 | 1441 | 966 | 1386 |
| Welland | 2022 | 27.8 | 12.6 | 1.9 | 193 | 1335 | 885 | 1317 |
| | 2021 | 29.1 | 12.5 | 66.1 | 195 | 1431 | 952 | 1378 |
| | 10 YR Avg. (2011-20) | 28.6 | 15.2 | 11.2 | 281 | 1411 | 916 | 1444 |
| Elora | 2022 | 26.1 | 10.2 | 10.9 | 178 | 1181 | 753 | 1132 |
| | 2021 | 29.6 | 9.7 | 14.7 | 182 | 1313 | 848 | 1258 |
| | 10 YR Avg. (2011-20) | 28.1 | 12.5 | 24.7 | 291 | 1257 | 776 | 1275 |
| Mount Forest | 2022 | 25.5 | 11.3 | 7.0 | 195 | 1181 | 759 | 1152 |
| | 2021 | 30.0 | 8.7 | 23.2 | 197 | 1319 | 857 | 1263 |
| | 10 YR Avg. (2011-20) | 27.8 | 13.0 | 23.5 | 285 | 1238 | 765 | 1269 |
| Peterborough | 2022 | 24.7 | 6.5 | 6.2 | 219 | 1183 | 741 | 1155 |
| | 2021 | 29.2 | 10.3 | 67.5 | 229 | 1300 | 824 | 1237 |
| | 10 YR Avg. (2011-20) | 28.8 | 12.4 | 9.7 | 258 | 1273 | 792 | 1281 |
| Kemptville | 2022 | 26.5 | 12.8 | 7.7 | 314 | 1280 | 818 | 1262 |
| | 2021 | 30.0 | 10.5 | 15.9 | 188 | 1417 | 935 | 1324 |
| | 10 YR Avg. (2011-20) | 29.8 | 14.4 | 16.7 | 279 | 1336 | 856 | 1363 |
| Earlton | 2022 | 26.0 | 7.3 | 7.9 | 199 | 1051 | 657 | 1085 |
| | 2021 | 28.7 | 5.6 | 3.8 | 220 | 1215 | 758 | 1131 |
| | 10 YR Avg. (2011-20) | 28.4 | 11.0 | 19.4 | 235 | 1033 | 636 | 1098 |
| Sudbury | 2022 | 22.5 | 10.2 | 12.1 | 208 | 1048 | 645 | 1066 |
| | 2021 | 27.3 | 10.1 | 2.1 | 200 | 1222 | 766 | 1157 |
| | 10 YR Avg. (2011-20) | 28.2 | 12.1 | 24.0 | 264 | 1117 | 697 | 1178 |
| Thunder Bay | 2022 | 22.5 | 7.6 | 8.2 | 352 | 843 | 477 | 824 |
| | 2021 | 32.1 | 1.6 | 0.0 | 203 | 1095 | 652 | 1051 |
| | 10 YR Avg. (2011-20) | 27.8 | 10.4 | 20.5 | 261 | 952 | 544 | 965 |
| Fort Frances | 2022 | 23.6 | 12.2 | 11.8 | 389 | 903 | 539 | 937 |
| | 2021 | 32.8 | 4.4 | 1.1 | 155 | 1166 | 718 | 1156 |
| | 10 YR Avg. (2011-20) | 27.9 | 10.9 | 25.5 | 251 | 1071 | 645 | 1115 |
2 thoughts on “Ontario Field Crop Report – July 13, 2022”
Comments are closed.