How Close is Your Corn Nitrogen Rate to Optimum? Testing Nitrogen Rates On-Farm.
Simple Summary
- Three methods can provide insight for how close grower corn nitrogen (N) rates may be to the optimum
- Multi-Rate N Trial – the most accurate for determining optimum N rates, but also the most work
- Delta-Yield Estimation – provides a reasonable estimate of optimum N rates with only two rates (zero and non-limiting N)
- The “+/- 30-lb” Test – does not provide an optimum N rate, but indicates if yield is being left on the table, or excess N is being applied, relative to grower N rate
- Because optimum N rates vary across years and landscapes, replication of tests over time and space are critical… one test strip in one year may not reflect typical long-term results.
- Building a database of N rate tests may provide confidence for making N rate adjustments in the future.
Whether it’s managing high nitrogen (N) fertilizer costs, or a desire to fine-tune N rates, you’ve maybe asked yourself “how close are my N rates to optimum”? If you’ve underapplied N before, you’ve likely received visual cues for what rates are too low. If you haven’t, how do you know if you are typically close to the edge, or applying much more N than what you need most years?
Many tools are available to guide N rate decisions (Ontario corn N calculator, soil nitrate sampling, legume/manure nitrogen credits), but nothing beats good on-farm N response data. The following three methods might assist in determining how close your corn N rates are to the optimum.
1. Multi-Rate N Trial
The gold standard for determining optimum N rates is the multi-rate N trial. Several (e.g., five rates) N rates are applied from zero (or starter only) to a non-limiting rate (e.g., 200-250 lb-N/ac), and an N response curve is generated (Figure 1). The optimum N rate (also known as Most Economic Rate of Nitrogen, or MERN) typically occurs a little before yields plateau (Rosser, 2022).
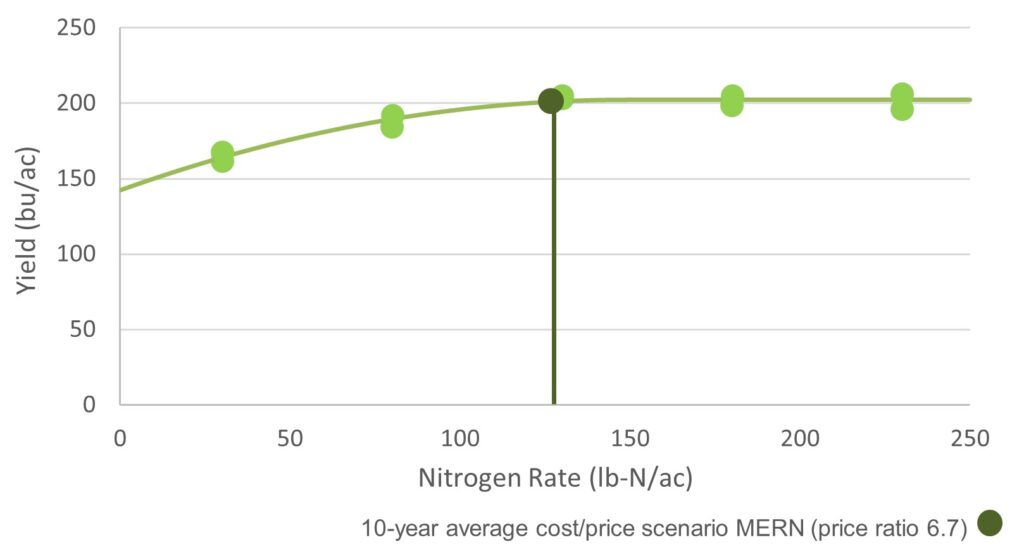
For example, in Figure 1, five N rates were applied and yields from those rates are used to generate an N response curve. Yields plateaued at 149 lb-N/ac (202 bu/ac) while the optimum N rate (MERN) occurred at 127 lb-N/ac (201 bu/ac, assuming a 10-year average price ratio of 6.7, e.g., $0.60/lb-N and $5.00/bu or $0.089/lb-corn). Optimum N rate will shift a bit on the curve depending on price ratio changes, such as those observed in 2022 (Rosser, 2022). While this method gives the most accurate result, it also creates the most work and yield risk.
PROS
- Most accurate method to determine optimum N rate for the test area for the test year
CONS
- Requires several N rates which should ideally be replicated (lots of plots to manage and collect data from)
- May include several N rates where there can be significant yield loss
- Statistical software likely required to fit a true yield response curve
2. Delta-Yield Estimation
A shortcut to the multi-rate N trial is the delta-yield estimation method using the “N-Rate Evaluator” tool at gocorn.net (Figure 2). This method only requires 2 rates: a zero-N rate (reflecting yields produced from natural soil N supply) and a non-limiting rate (reflecting yield potential where N is not limiting).

While we can’t calculate the true optimum N rate like in the multi-rate N trial, the difference in yield (“delta-yield”) between these two treatments allows us to estimate the optimum N rate based on relationships established in historical Ontario N datasets. Ontario research suggests these estimates provide sound guidance where multi-rate trials are not an attractive option (Janovicek et al, 2020).
For example, for the N response curve in Figure 1, using the zero-N rate resulted in yield of 142 bu/ac and the non-limiting yield of 202 bu/ac, and N and corn prices that produce the same 10-year average price ratio of 6.7 would have estimated an optimum N rate of 116 lb-N/ac.
PROS
- Only requires 2 N rates
- Does not provide the true optimum N rate that a multi-rate trial does, but still provides an estimate which has been shown to typically provide sound guidance
CONS
- Requires a zero N rate which is likely to produce yield losses
3. The “+/- 30-lb” Test
The simplest method is likely the “+/- 30-lb” test. This involves testing a N rate a little higher and a little lower than the normal field N rate to see if yields respond. While this won’t deliver an optimum N rate like the first two methods, it will give an indication of whether normal field N rates might be high, low, or about right. The N rate adjustments should be enough to elicit a yield response, but not so much that it doesn’t help zero in on an appropriate rate. A good starting point may be testing rates +/- 30 lb-N/ac from the normal field rate.
If, over time:
- Yields rarely decline for a lower N rate, perhaps there is justification to reduce rates a bit (and continue testing at the new rate)
- Yield consistently respond to a higher N rate, perhaps there is justification to increase rates a bit (and continue testing at the new rate)
- Yields don’t always increase with higher N rates, or decrease with lower N rates, the normal field rate may be close to optimum
PROS
- Only requires 2 N rates (outside of the normal field rate)
- Does not require very low N rates, yield losses are likely minimal
CONS
- Does not provide the actual, or an estimate of, the optimum N rate
Parting Comments
As we know from experience, optimum N rates vary year-to-year and spatially across fields. One test in one year gives us an idea of what worked in that spot for that year, but replication of N tests over time and space is critical for confident decision making. For instance, some growers have replicated test strips within fields across several years to get an idea of what fields reliably need more or less N than others so they can adjust N rates by field.
It’s also helpful to capture extreme years in datasets (years with significantly lower or higher rainfall, N losses, yields) to understand what floor or ceiling N rates may be for a given field.
If in-crop N applications are made, a long-term dataset may provide insight for making N rate adjustments by looking at past performance of test strips, and how optimum rates may have changed with cues like rainfall.
References
Janovicek, K., K. Banger, J. Sulik, J. Nasielski, B. Deen. 2020. Delta yield-based optimal nitrogen rate estimates for corn are often economically sound. Agron. J. 113:1961-1973. https://doi.org/10.1002/agj2.20521
Rosser, B. 2022. Understanding MERN (Most Economic Rate of Nitrogen) for Corn. FieldCropNews.com. https://fieldcropnews.com/2022/04/understanding-mern-most-economic-rate-of-nitrogen-for-corn/ (accessed 30 Aug. 2022).
Weather Data – Weekly August 22 – 28, 2022
| Location | Year | Highest Temp (°C) | Lowest Temp (°C) | Rain (mm) | Rain (mm) April 1st | GDD 0C April 1st | GDD 5C April 1st | CHU May 1st |
| Harrow | 2022 | 27.4 | 11.7 | 3.1 | 377 | 2624 | 1906 | 2933 |
| | 2021 | 30.6 | 18.0 | 9.6 | 447 | 2657 | 1925 | 2872 |
| | 10 YR Avg. (2011-20) | 26.7 | 13.7 | 17.6 | 458 | 2606 | 1858 | 2922 |
| Ridgetown | 2022 | 28.9 | 8.7 | 0.3 | 269 | 2480 | 1771 | 2709 |
| | 2021 | 30.8 | 16.2 | 12.9 | 427 | 2513 | 1790 | 2709 |
| | 10 YR Avg. (2011-20) | 25.9 | 12.5 | 13.5 | 411 | 2453 | 1710 | 2721 |
| London | 2022 | 28.4 | 10.4 | 1.6 | 307 | 2422 | 1716 | 2645 |
| | 2021 | 30.5 | 16.7 | 7.0 | 341 | 2497 | 1779 | 2674 |
| | 10 YR Avg. (2011-20) | 25.9 | 12.7 | 21.3 | 430 | 2432 | 1694 | 2705 |
| Brantford | 2022 | 29.6 | 10.3 | 5.9 | 276 | 2434 | 1723 | 2598 |
| | 2021 | 32.7 | 15.6 | 1.5 | 303 | 2468 | 1749 | 2622 |
| Welland | 2022 | 28.4 | 12.4 | 2.2 | 294 | 2488 | 1768 | 2736 |
| | 2021 | 31.4 | 16.3 | 0.0 | 298 | 2480 | 1756 | 2670 |
| | 10 YR Avg. (2011-20) | 25.9 | 12.3 | 6.8 | 378 | 2447 | 1707 | 2725 |
| Elora | 2022 | 27.8 | 9.0 | 15.6 | 243 | 2229 | 1530 | 2382 |
| | 2021 | 31.4 | 14.0 | 6.1 | 272 | 2291 | 1581 | 2442 |
| | 10 YR Avg. (2011-20) | 24.2 | 10.9 | 15.7 | 425 | 2198 | 1472 | 2422 |
| Mount Forest | 2022 | 26.7 | 8.6 | 25.4 | 336 | 2221 | 1529 | 2416 |
| | 2021 | 29.2 | 15.8 | 34.0 | 394 | 2294 | 1587 | 2459 |
| | 10 YR Avg. (2011-20) | 24.0 | 11.9 | 9.7 | 436 | 2185 | 1467 | 2436 |
| Peterborough | 2022 | 28.1 | 7.8 | 11.5 | 317 | 2239 | 1527 | 2399 |
| | 2021 | 31.1 | 13.0 | 0.0 | 301 | 2298 | 1577 | 2429 |
| | 10 YR Avg. (2011-20) | 25.5 | 10.1 | 13.7 | 378 | 2233 | 1506 | 2427 |
| Kemptville | 2022 | 29.2 | 8.8 | 22.3 | 430 | 2394 | 1661 | 2608 |
| | 2021 | 33.7 | 15.2 | 1.4 | 267 | 2465 | 1738 | 2588 |
| | 10 YR Avg. (2011-20) | 26.2 | 12.0 | 18.9 | 426 | 2348 | 1623 | 2593 |
| Earlton | 2022 | 26.0 | 9.6 | 0.5 | 327 | 2023 | 1360 | 2230 |
| | 2021 | 30.0 | 9.8 | 19.6 | 470 | 2136 | 1434 | 2229 |
| | 10 YR Avg. (2011-20) | 23.3 | 10.0 | 14.6 | 365 | 1912 | 1270 | 2158 |
| Sudbury | 2022 | 26.1 | 11.3 | 7.8 | 303 | 2055 | 1382 | 2298 |
| | 2021 | 30.0 | 12.3 | 7.4 | 383 | 2171 | 1470 | 2305 |
| | 10 YR Avg. (2011-20) | 23.6 | 11.0 | 19.8 | 402 | 2045 | 1381 | 2317 |
| Thunder Bay | 2022 | 27.6 | 11.1 | 8.7 | 453 | 1818 | 1183 | 1974 |
| | 2021 | 31.5 | 6.6 | 14.1 | 242 | 2020 | 1333 | 2118 |
| | 10 YR Avg. (2011-20) | 24.1 | 9.3 | 15.9 | 371 | 1829 | 1175 | 2013 |
| Fort Frances | 2022 | 28.7 | 8.4 | 16.5 | 571 | 1900 | 1266 | 2127 |
| | 2021 | 25.2 | 3.8 | 16.2 | 227 | 2116 | 1423 | 2245 |
| | 10 YR Avg. (2011-20) | 25.1 | 8.1 | 15.0 | 373 | 1952 | 1280 | 2161 |