Co-authored with Ken Janovicek and Dr. Dave Hooker, University of Guelph
Highlights
- Corn and soybean yields increase when rotated with winter wheat
- Wheat in rotation reduces the yield gap between conventional and no-till corn
- Wheat-containing rotations increase net farm returns relative to a corn-soybean rotation
By now, you’ve likely heard the message from the long-term rotation trials at Ridgetown and Elora: winter wheat in rotation improves corn and soybean yields. But with greater revenue coming in during corn and soybean years, the real question is whether these yield benefits outweigh revenue reductions from wheat years. In this article, we’ll answer that question and arm you with the economic information to make sound crop rotation decisions on your farm.
Evaluating crop rotation economics
In 2021, an economic analysis of the long-term rotation-tillage trials (Figure 1) was published by University of Guelph researchers Ken Janovicek, Dave Hooker and Bill Deen, along with economists Alfons Weersink and Richard Vyn. They compared yields from the first five rotation cycles (1982-2001) to the latest four (2002-2017) at Elora and looked at yields from 2012-2017 at Ridgetown. They asked the questions: does including wheat in a corn-soybean rotation increase yield and net returns on the crop enterprise of the farm? And does this benefit increase over time?
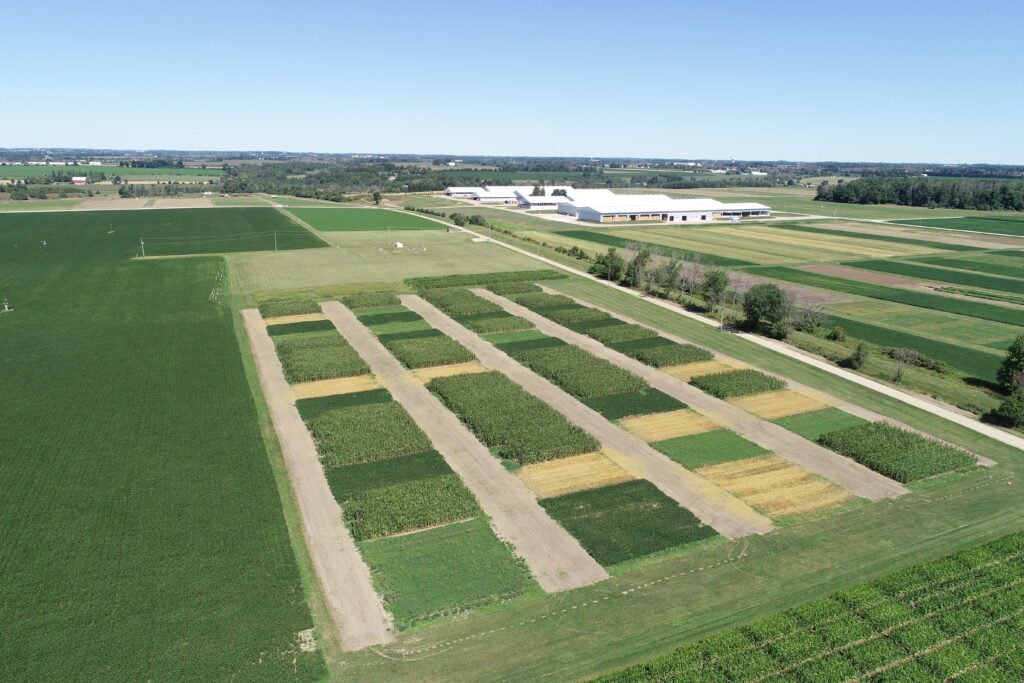
Figure 1. The long-term rotation-tillage system trials at the University of Guelph’s Ridgetown Campus (left) and Elora Research Station (right). Photos: L. Van Eerd and J. Sulik.
To answer these questions, cost assumptions were taken from the OMAFRA 2017 Field Crop Budgets publication. Crop prices were determined from mandatory monthly purchase reports submitted by Ontario licensed commodity dealers (for corn and soybeans) and on the final soft red winter wheat pool payment (Grain Farmers of Ontario). The assumed crop prices were $4.93/bu (corn), $12.95/bu (soybeans) and $5.63/bu (wheat). They were 5-year averages (2013–2017) corrected to 2017 dollars using the Bank of Canada Inflation Calculator (Bank of Canada, 2019).
What did they find?
Corn and soybean yields
Winter wheat in rotation increased corn and soybean yields. On average from 2002-2017, including wheat in rotation increased first-year corn yields at Elora by over eight bu/ac and soybean yields by over five bu/ac compared to a corn-corn-soybean-soybean rotation (Table 1). The yield improvement in soybeans due to wheat rose from 3% (1982-2001) to 12% (2002-2017).
Table 1. First-year corn and first-year soybean yields (from 1982-2001 and 2002-2017) within different crop rotations from the long-term rotation-tillage system trial, Elora. Averaged across tillage systems. Values with the same letter in the same column are not statistically different (P<0.05).
| Rotation | First-year corn yield (bu/ac) | First-year corn yield (bu/ac) | First-year soybean yield (bu/ac) | First-year soybean yield (bu/ac) |
| 1982-2001 | 2002-2017 | 1982-2001 | 2002-2017 | |
| Continuous corn | 122.1 b | 143.2 c | – | – |
| Corn-corn-soybean-soybean | 127.7 a | 156.8 b | 36.7 b | 42.8 b |
| Corn-corn-soybean-w. wheat | 128.1 a | 165.0 a | 37.8 ab | 48.1 a |
| Corn-corn-soybean-w. wheat (red clover) | 131.7 a | 162.7 a | 39.0 a | 47.5 a |
At Ridgetown, corn in a corn-soybean-wheat rotation yielded 5.8 bu/ac over corn in rotation with only soybeans. When wheat was under-seeded with red clover, corn yields were nearly 14 bu/ac higher compared to where corn was rotated only with soybeans (Table 2). Soybeans yielded five bu/ac higher with wheat in rotation compared to a corn-soybean rotation.
Table 2. Corn and soybean yields (averaged from 2012-2017 across tillage treatments) within different crop rotations from the long-term rotation-tillage system trial, Ridgetown. Values with the same letter in the same column are not statistically different (P<0.05).
| Rotation | Corn yield (bu/ac) | Soybean yield (bu/ac) |
| Continuous corn | 194.5 b | – |
| Corn-soybean | 195.6 b | 62.2 b |
| Corn-soybean-w. wheat | 201.4 ab | 66.9 a |
| Corn-soybean-w. wheat (red clover) | 209.3 a | 67.8 a |
Impact of rotation on no-till corn
Furthermore, including wheat in rotation helped to close the gap between no-till (NT) and conventional tillage (CT) yields at the Elora site (Figure 2). Corn yields under no-till in a corn-corn-soybean-wheat (CCSW) rotation were roughly equal to conventional tillage yields with a two-crop rotation (162 vs. 163.8 bu/ac, respectively).
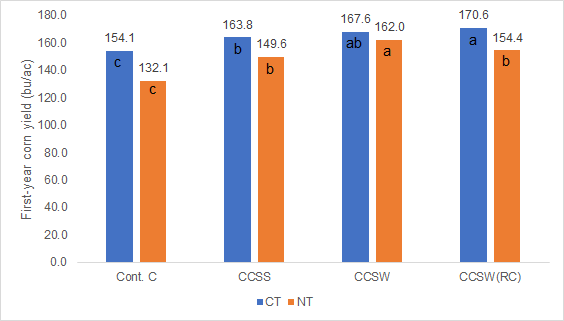
Figure 2. First-year corn yields (2002-2017) for four crop rotations in conventional and no-till tillage systems at the long-term rotation-tillage system trial, Elora. Values within the same tillage treatment with the same letter are not statistically different (P<0.05).
Net returns
Yield improvements in corn and soybeans are great, but do they make up for the reduced revenue during wheat years?
The short answer is yes – assuming straw is sold. Figure 3 shows average net returns across three rotations from the Ridgetown trial. Maximum net returns from 2012-2017 were achieved in the corn-soybean-wheat rotation with red clover ($371/ac) if the wheat straw was sold (assuming $0.03/lb price). Wheat yields averaged 112-114 bu/ac during this time.
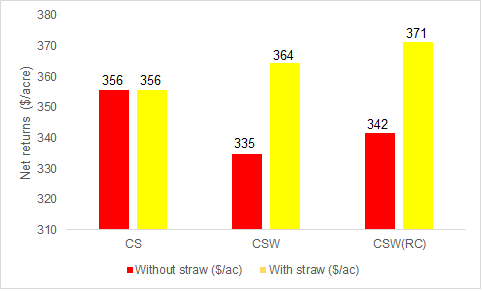
Figure 3. Average annual net returns across three different crop rotations from 2012-2017 from the long-term rotation-tillage system trial, Ridgetown, with and without straw sale. Assumes straw yield of 4 tonnes/ha (1.8 tons/ac) and cost of associated P and K nutrient removal.
At the Elora trial, wheat-containing rotations provided greater net returns than continuous corn or corn-soybean rotations (Table 3). And the benefit increased over time. The values below do not include revenue from straw sales, which would add about $20/ac to returns in wheat-containing rotations. Also, the economic advantage to more diverse rotations was found despite achieving only average wheat yields (79 bu/ac) from 2002-2017 (provincial average: 78 bu/ac). If yields had been above-average, the economic advantage to wheat-containing rotations would have been greater.
Table 3. Annual net returns – averaged between conventional tillage and reduced tillage systems – across three different crop rotations from the long-term rotation-tillage system trial, Elora. Net returns do not include revenue from straw sale. Values with the same letter in the same column are not statistically different (P<0.05).
| Net returns, $/ac (1982-2001) | Net returns, $/ac (2002-2017) | |
| Continuous corn | 50 b | 125 c |
| Corn-corn-soybean-soybean | 85 a | 165 b |
| Corn-corn-soybean-w. wheat | 85 a | 179 a |
| Corn-corn-soybean-w. wheat (red clover) | 88 a | 175 ab |
In 2023, higher commodity prices favour the wheat enterprise even more than what was evaluated in this study. Wheat price relative to both corn and soybean price was higher in the last half of 2022 (GFO, 2022) than the prices used from 2013-2017 in this analysis. High commodity prices for corn and soybean also favour wheat since including it in rotation increases corn and soybean yields and revenues from those crop enterprises.
What does it mean?
Including winter wheat in rotation makes sound economic sense, especially when straw is sold. By gaining extra value from the wheat phase in rotation – for example, by growing a nitrogen credit through red clover or harvesting an annual forage such as oats – farmers can further increase their rotation advantage. Previous, peer-reviewed research from University of Guelph, Ridgetown, shows that wheat in rotation increases nitrogen use efficiency in corn years, even without under-seeded red clover. And though it was not evaluated in this study, wheat in rotation can enable more timely corn and soybean planting due to fewer total corn and soybean acres.
Besides the economics, wheat growers know the other benefits it provides to the cropping system. From spreading workload and weather risks, to providing an opportunity to apply manure or fertilizer under dry conditions, winter wheat brings a lot to the table. So, if you grow wheat in rotation with corn and soybeans, keep it up – the research supports that it not only improves your soil, but can also raise your bottom line. And if you don’t currently grow wheat, consider adding it in. As the results show, even including wheat in just one year out of four is a great way to increase profitability over time.
References
Grain Farmers of Ontario (GFO). 2022. Average Commodity Prices. Retrieved from: https://gfo.ca/marketing/average-commodity-prices/
Janovicek K, Hooker D, Weersink A, Vyn R, Deen B. Corn and soybean yields and returns are greater in rotations with wheat. Agronomy Journal. 2021;113:1691–1711. https://doi.org/10.1002/agj2.20605