Getting to Know your Manure with a Manure Analysis
The “magical” qualities of manure and organic amendments for providing long-term benefits have been well documented, especially for maintaining and improving soil organic matter. Sourcing off farm manure and organic amendments has become more difficult and expensive with the increased interest in improving soil health, therefore it is more important than ever to know what your “black gold” is providing.
It is recommended to submit a manure or organic amendment sample before you land apply. Once you get your manure analysis report back, what do those numbers mean? Since manure and organic amendments are variable, understanding what nutrients are in the material is important for maximizing economic benefit.
The Analysis Report
Dry Matter/moisture measures how much liquid is in the sample. While self-explanatory, the moisture content does affect economics of application. A material that has 2% dry matter has 98% water. Most reports show nutrients “as-applied,” which means the higher the water content the less nutrients being applied. Moving water will reduce the economic value for materials that require transportation to where application will occur.
Nitrogen, phosphorus, and potassium are the most valuable nutrients; however, organic amendments can also be rich in micronutrients and organic matter. Micronutrients such as sulphur (S), magnesium (Mg) and zinc (Zn) in the manure test can reduce starter fertilizer requirements, especially where manure is applied regularly. Other tests such as pH, total salts, or EC (Electrical Conductivity) and carbon to nitrogen (C:N) ratio can help with nitrogen management. Below are more details to consider about these nutrients:
- Nitrogen is one of the main nutrients in manure and has several different forms, but only organic and ammonium nitrogen provide significant nitrogen contribution to crops
- Total nitrogen (N) includes all the forms of nitrogen in the material
- Ammonium N (NH4-N) is the fraction that is immediately plant-available
- Organic N is the remaining fraction and is referred to as “slow-release N since it will need to be mineralized by soil microorganism before plant utilization.
The plant available N from manure will depend on management. The NH4-N fraction can be easily lost depending on timing of application, time to incorporation and weather and soil conditions. Materials applied and quickly incorporated into the soil will have the lowest risk of N losses to the atmosphere or runoff or leaching to water sources. The availability of the organic N fraction will depend on timing of application, and microbial activity based on weather and soil conditions. The organic amendment tool in AgriSuite will provide an estimate of available nutrients and economic value based on analysis and management details.
- Phosphorus (P) content in organic amendments is significant, but variable with different livestock species or types of amendments. Phosphorus is tied to soil particles and when materials are surface applied P is vulnerable to losses through surface runoff or soil erosion. It is reported as percent total P, but on the lab report is converted to phosphate (P2O5). About 80% of the P in manure will become available, although not all of it is immediately plant available.
- Potassium (K) content also varies between amendments and can be especially low in sewage biosolids. Potassium is reported as percent K, but on a lab report is usually converted to potash (K2O). About 90% is assumed to become available for plants.
- Sulphur in organic amendments is available as elemental, or a slow-release form. Spring application of manure may not supply the needs for a crop that has early season sulphur requirements.
- pH measures the acidity or alkalinity of the material. pH 7 is neutral, but as pH increases to over 7.8, and when combined with temperatures over 20oC, the amount of N as NH4-N which attaches to soil particles decreases while the portion as NH3-N gas increases. Surface applied on hot days could result in complete loss of the NH3/NH4 portion within a few hours. Injection or rapid incorporation reduces N loss with high pH materials applied during the growing season (See Figure 1).
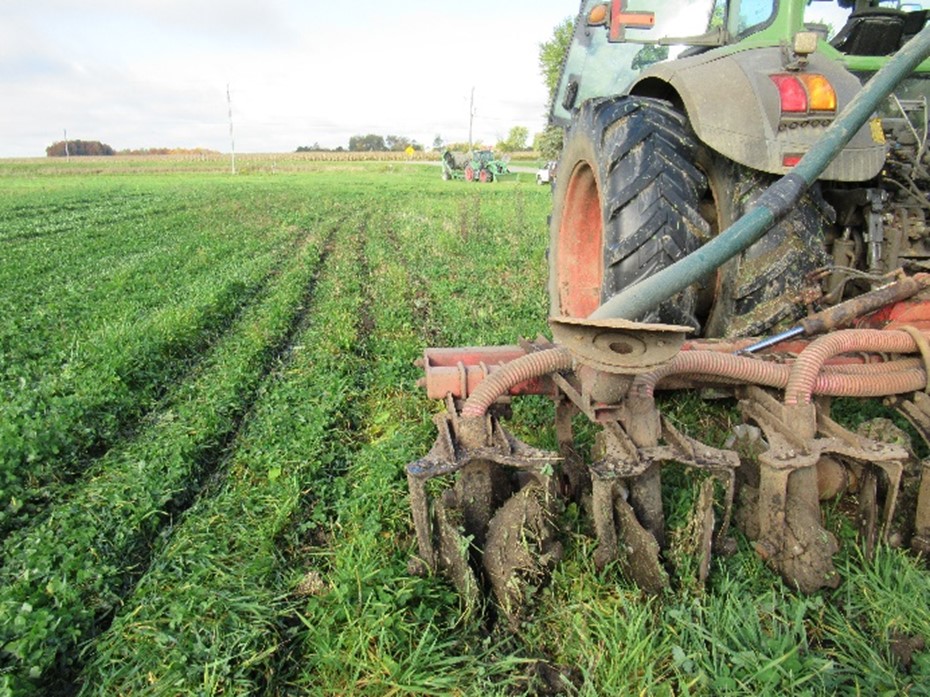
Figure 1. Injecting anaerobic digestate after wheat harvest into a growing cover crop to maximize soil health benefits and economic value of nutrients.
- Carbon-to-Nitrogen Ratio (C:N) measures the proportion of carbon to nitrogen in an organic material. C:N ratio indicates how quickly carbon breakdown may occur and whether a material will immobilize or mineralize nitrogen. Mineralization of organic N occurs when there is adequate N to break down carbon. As an organic material’s C:N ratio rises above that of soil (~10:1), soil microorganisms “steal” nitrogen from the soil to breakdown carbon. Solid manure with a high amount of bedding will often have a C:N ratio above 20 to 25:1 and when applied to a corn crop, immobilization of soil N could result in short-term nitrogen deficiency.
- Total Salts (EC) or Electrical Conductivity measures all soluble salts including K, NH4, Mg, Ca, Al and sodium (Na). This measurement can be used to help determine salt additions and potential salinity. In Ontario, adequate rainfall leaches salts out of the root zone however high EC may cause germination/seedling root injury or when planting occurs too soon after application or as leaf burn when applied onto standing crops or if organic materials are surface applied (i.e., no-till) and conditions are very dry. High sodium added to soil can decrease the aggregate structure and porosity of fine / medium-textured soils
- Other tests – Aluminum (Al), Iron (Fe), Boron (B), or heavy metals (e.g., copper (Cu)) tests can be useful in certain crop circumstances. For example, crop growth could be impacted where biosolids are applied to a sandy field with very low pH due to high levels or aluminum or iron used in the treatment process. Organic amendments applied to forages or pastures used for sheep should be tested for copper since relatively low levels of copper can be toxic to sheep.
Maximize Economic Value by Using Manure Test Results
Manure analysis results are most useful, in combination with soil test results, to calibrate application rates. Applying a rate to meet crop phosphorus needs, where soil fertility levels are already adequate or high, will often require supplementing nitrogen-loving crops with additional commercial N. An organic material should not be applied at a rate where it will meet all the N needs of a crop such as corn or wheat, since cool, wet weather conditions can delay mineralization and/or nitrification of manure N. The release of available N will not always coincide with the timing of peak crop N needs.
Although a manure analysis is just a snapshot of the material being applied, it can provide input in deciding whether a potential organic amendment will economically provide the intended benefits. Using the manure analysis results will help determine which field is the best fit for the nutrient and Organic Matter (OM) composition of the organic amendment and what is the best timing for application. Economic value is maximized when the nutrients and the organic matter in the material are considered and when the composition of the material matches the timing, placement, and location.
Weather Data – July 17 – 23, 2023
| Location | Year | Highest Temp (°C) | Lowest Temp (°C) | Rain (mm) | Rain (mm) April 1st | GDD 0C April 1st | GDD 5C April 1st | CHU May 1st |
| Harrow | 2023 | 28.9 | 14.0 | 15.1 | 289 | 1779 | 1220 | 1788 |
| 2022 | 30.7 | 19.0 | 21.1 | 301 | 1866 | 1323 | 1988 | |
| 10 YR Norm (11 – 20) | 28.5 | 16.0 | 28.4 | 377 | 1961 | 1363 | 2114 | |
| Ridgetown | 2023 | 27.8 | 12.0 | 31.3 | 380 | 1687 | 1136 | 1662 |
| | 2022 | 32.2 | 17.5 | 5.9 | 210 | 1751 | 1216 | 1823 |
| | 10 YR Avg. (2011-20) | 28.0 | 13.8 | 38.7 | 335 | 1843 | 1251 | 1969 |
| London | 2023 | 27.5 | 12.2 | 11.4 | 337 | 1680 | 1130 | 1659 |
| | 2022 | 33.5 | 15.9 | 25.2 | 228 | 1699 | 1174 | 1768 |
| | 10 YR Avg. (2011-20) | 27.7 | 14.5 | 15.8 | 336 | 1821 | 1233 | 1950 |
| Brantford | 2023 | 28.0 | 11.7 | 8.6 | 295 | 1670 | 1119 | 1650 |
| | 2022 | 33.6 | 16.3 | 29.3 | 230 | 1703 | 1168 | 1723 |
| Welland | 2023 | 27.1 | 13.8 | 14.8 | 301 | 1689 | 1132 | 1665 |
| | 2022 | 30.2 | 17.5 | 44.3 | 249 | 1750 | 1205 | 1827 |
| | 10 YR Avg. (2011-20) | 27.9 | 15.0 | 18.3 | 319 | 1828 | 1238 | 1961 |
| Elora | 2023 | 27.4 | 10.1 | 37.7 | 308 | 1540 | 1006 | 1513 |
| | 2022 | 31.8 | 13.4 | 17.2 | 196 | 1557 | 1033 | 1577 |
| | 10 YR Avg. (2011-20) | 26.7 | 12.0 | 18.2 | 334 | 1638 | 1062 | 1739 |
| Mount Forest | 2023 | 27.1 | 11.0 | 5.1 | 297 | 1537 | 1008 | 1514 |
| | 2022 | 30.6 | 14.1 | 31.8 | 239 | 1557 | 1040 | 1608 |
| | 10 YR Avg. (2011-20) | 26.1 | 12.9 | 24.1 | 338 | 1618 | 1050 | 1736 |
| Peterborough | 2023 | 27.8 | 9.0 | 35.7 | 300 | 1571 | 1024 | 1509 |
| | 2022 | 31.1 | 14.8 | 34.2 | 262 | 1571 | 1033 | 1619 |
| | 10 YR Avg. (2011-20) | 28.4 | 12.1 | 19.4 | 296 | 1662 | 1086 | 1744 |
| Kemptville | 2023 | 29.3 | 11.2 | 13.8 | 315 | 1685 | 1144 | 1645 |
| | 2022 | 30.7 | 17.0 | 37.8 | 384 | 1682 | 1124 | 1747 |
| | 10 YR Avg. (2011-20) | 28.9 | 13.3 | 22.7 | 326 | 1744 | 1169 | 1856 |
| Earlton | 2023 | 27.5 | 7.7 | 11.5 | 253 | 1426 | 932 | 1445 |
| | 2022 | 31.7 | 14.0 | 42.4 | 251 | 1409 | 920 | 1506 |
| | 10 YR Avg. (2011-20) | 26.4 | 10.3 | 17.3 | 278 | 1391 | 899 | 1531 |
| Sudbury | 2023 | 26.7 | 9.1 | 31.6 | 401 | 1442 | 949 | 1460 |
| | 2022 | 29.4 | 15.5 | 36.8 | 248 | 1412 | 914 | 1511 |
| | 10 YR Avg. (2011-20) | 26.7 | 12.6 | 24.0 | 310 | 1493 | 978 | 1638 |
| Thunder Bay | 2023 | 26.7 | 7.0 | 14.8 | 199 | 1256 | 784 | 1297 |
| | 2022 | 32.4 | 11.7 | 23.9 | 388 | 1184 | 723 | 1220 |
| | 10 YR Avg. (2011-20) | 26.1 | 11.0 | 13.0 | 306 | 1306 | 803 | 1392 |
| Fort Frances | 2023 | 26.6 | 10.5 | 36.1 | 231 | 1425 | 946 | 1510 |
| | 2022 | 28.5 | 11.6 | 30.6 | 505 | 1267 | 808 | 1372 |
| | 10 YR Avg. (2011-20) | 26.5 | 10.7 | 23.1 | 309 | 1433 | 911 | 1550 |
3 thoughts on “Crop Report – Week of July 24th, 2023”
Comments are closed.