Dimethoate Resistant Two-Spotted Spider Mite Populations in Ontario Soybeans
Results from bioassays conducted on two-spotted spider mite (TSSM) populations collected in soybean fields across Ontario show the prevalence of dimethoate (Cygon or Lagon) resistance is high in some areas. Through a collaborative project with Dr. Vojislava Grbic, Professor at Western University, Dr. Ian Scott at AAFC-London and OMAFRA, Drs. Joseane Nascimento and Vladimir Zhurov at Western University analyzed mite populations collected in 2021 and 2022 before or after failed dimethoate applications.
Out of 31 fields tested, 18 (58% of sites) were found to have resistant TSSM populations (Figure 1). Fields with dark green dots had TSSM populations that were still susceptible to dimethoate (100% kill), while fields with yellow (50% killed), orange or red (0% killed) dots had populations that were only partially killed or were fully resistant. Soybean fields close to one another tend to have similar levels of resistance.
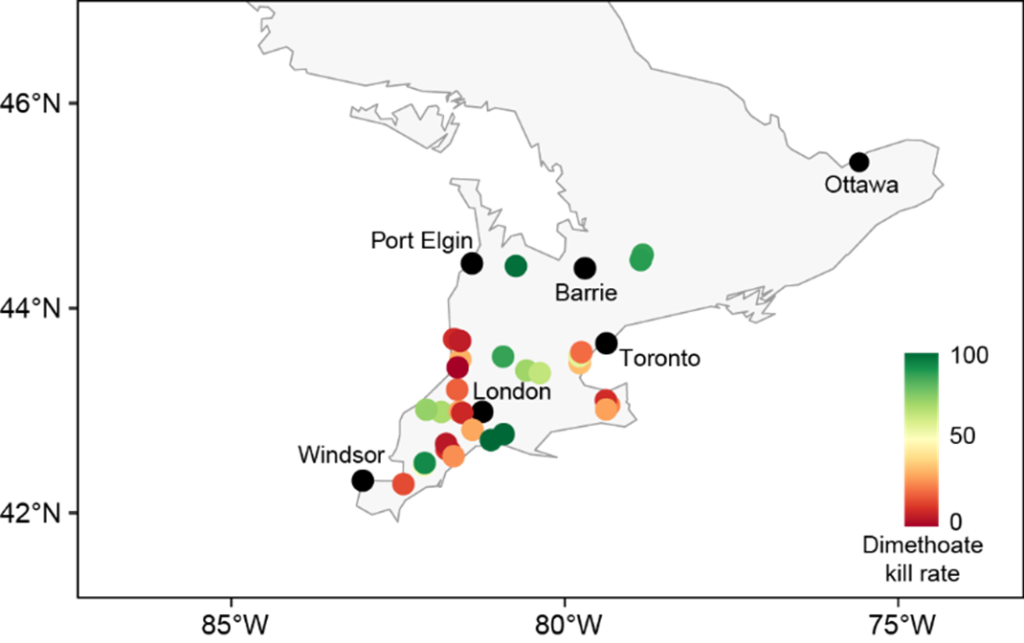
Figure 1. Levels of dimethoate effectiveness in two-spotted spider mite populations collected in 31 soybean fields in 2021 and 2022.
As part of the study, other miticides currently registered on horticultural crops were tested against these TSSM populations as potential candidates for registration on soybeans. These include the active ingredients abamectin, bifenazate, cyflumetofen, etoxazole, pyridaben and spiromesifen. Spiromesifen (as Oberon) is the only miticide registered on field crops (corn and dry beans) in Canada. The heatmap see (Figure 2.) shows the mortality rates of the bioassays performed by location and active ingredient. In general, TSSM populations collected on soybeans were susceptible to these miticides, except for a few localized populations that show tolerance to spiromesifen (Wardsville and West Elgin) or abamectin (Niagara). This isn’t entirely surprising, given TSSM are pests of almost all horticultural crops and are easily carried by wind from neighbouring fields where these products are already in use. Some active ingredients are showing promise as good candidates for registration of soybeans.
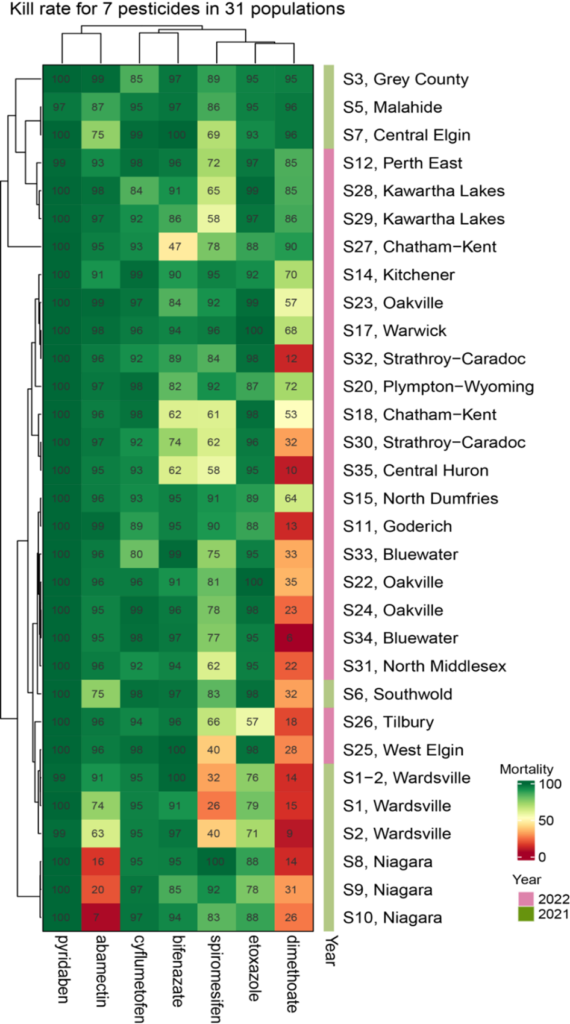
Figure 2. Summary heatmap showing results of bioassays with seven active ingredients on spider mite samples collected from soybean fields in southwestern Ontario in 2021-2022.
Fingers crossed for frequent rains to keep TSSM infestations low this year. If the season turns hot and dry, we are at risk of significant yield loss if dimethoate applications fail. Until new cost-effective products are registered on soybeans, we may need to explore other Integrated Pest Management (IPM) strategies to manage or reduce the risk of TSSM infestations. Preliminary research from Texas using low-cost releases of predatory mites looks promising as a biocontrol option against TSSM in field crops.
OMAFRA is looking for more TSSM populations in 2023 to have tested at Western. If you find any spider mite populations in soybeans or dry beans before a dimethoate application (preferable), or after an application that was not effective, please contact Tracey Baute at 519-360-7817 so that collections can be made. Thank you to all the crop consultants and growers who have participated so far in providing spider mite samples. Funding for this project is provided by The Grain Farmers of Ontario (GFO), Ontario Greenhouse Vegetable Growers and MITACS, and the Ontario Research Fund.
Weather Data – June 26 – July 2, 2023
| Location | Year | Highest Temp (°C) | Lowest Temp (°C) | Rain (mm) | Rain (mm) April 1st | GDD 0C April 1st | GDD 5C April 1st | CHU May 1st |
| Harrow | 2023 | 27.4 | 13.9 | 48.7 | 203 | 1323 | 869 | 1216 |
| | 2022 | 31.1 | 9.2 | 0.9 | 209 | 1388 | 950 | 1399 |
| | 10 YR Avg. (2011-20) | 28.6 | 16.5 | 33.3 | 319 | 1483 | 991 | 1521 |
| Ridgetown | 2023 | 29.3 | 11.9 | 95.8 | 282 | 1253 | 807 | 1127 |
| | 2022 | 31.2 | 6.6 | 2.4 | 177 | 1293 | 864 | 1275 |
| | 10 YR Avg. (2011-20) | 29.4 | 14.3 | 24.2 | 260 | 1389 | 902 | 1411 |
| London | 2023 | 29.0 | 8.1 | 26.0 | 272 | 1251 | 807 | 1132 |
| | 2022 | 29.8 | 6.6 | 8.6 | 190 | 1247 | 827 | 1225 |
| | 10 YR Avg. (2011-20) | 29.1 | 14.7 | 22.6 | 288 | 1366 | 882 | 1390 |
| Brantford | 2023 | 29.7 | 9.4 | 37.2 | 224 | 1242 | 795 | 1128 |
| | 2022 | 31.4 | 7.4 | 4.2 | 180 | 1249 | 818 | 1189 |
| Welland | 2023 | 27.7 | 10.7 | 59.9 | 240 | 1242 | 790 | 1111 |
| | 2022 | 29.3 | 10.7 | 1.2 | 191 | 1293 | 853 | 1266 |
| | 10 YR Avg. (2011-20) | 28.6 | 15.5 | 9.0 | 277 | 1368 | 883 | 1391 |
| Elora | 2023 | 27.5 | 7.4 | 25.5 | 188 | 1143 | 714 | 1033 |
| | 2022 | 28.9 | 7.0 | 3.7 | 167 | 1143 | 724 | 1086 |
| | 10 YR Avg. (2011-20) | 28.1 | 12.3 | 21.8 | 284 | 1217 | 746 | 1227 |
| Mount Forest | 2023 | 27.0 | 7.6 | 21.3 | 233 | 1139 | 715 | 1029 |
| | 2022 | 29.5 | 7.1 | 8.4 | 188 | 1143 | 731 | 1105 |
| | 10 YR Avg. (2011-20) | 27.8 | 12.6 | 13.1 | 274 | 1199 | 736 | 1221 |
| Peterborough | 2023 | 28.4 | 8.5 | 12.2 | 203 | 1152 | 711 | 1014 |
| | 2022 | 27.6 | 6.7 | 0.6 | 212 | 1154 | 721 | 1122 |
| | 10 YR Avg. (2011-20) | 28.8 | 12.4 | 13.0 | 256 | 1233 | 762 | 1234 |
| Kemptville | 2023 | 29.5 | 13.4 | 1.9 | 245 | 1217 | 781 | 1082 |
| | 2022 | 27.7 | 10.9 | 5.2 | 305 | 1243 | 790 | 1215 |
| | 10 YR Avg. (2011-20) | 29.8 | 14.5 | 12.7 | 275 | 1294 | 824 | 1312 |
| Earlton | 2023 | 29.2 | 5.4 | 10.7 | 204 | 1028 | 639 | 973 |
| | 2022 | 25.1 | 6.6 | 11.3 | 191 | 1019 | 636 | 1049 |
| | 10 YR Avg. (2011-20) | 28.4 | 11.0 | 16.5 | 230 | 995 | 609 | 1053 |
| Sudbury | 2023 | 28.9 | 7.3 | 30.8 | 314 | 1042 | 654 | 977 |
| | 2022 | 23.8 | 8.0 | 6.2 | 195 | 1015 | 623 | 1027 |
| | 10 YR Avg. (2011-20) | 28.2 | 12.1 | 17.8 | 254 | 1078 | 668 | 1131 |
| Thunder Bay | 2023 | 28.3 | 9.2 | 19.5 | 176 | 906 | 539 | 890 |
| | 2022 | 30.6 | 3.6 | 3.6 | 344 | 814 | 458 | 793 |
| | 10 YR Avg. (2011-20) | 27.8 | 10.1 | 22.3 | 257 | 916 | 517 | 922 |
| Fort Frances | 2023 | 29.7 | 7.7 | 18.0 | 154 | 1089 | 715 | 1120 |
| | 2022 | 26.3 | 2.4 | 4.0 | 377 | 868 | 515 | 895 |
| | 10 YR Avg. (2011-20) | 27.9 | 9.8 | 23.7 | 246 | 1034 | 617 | 1071 |
2 thoughts on “Crop Report – Week of July 3rd, 2023”
Comments are closed.