Soil Sampling – Matching Field to Method
Soil testing is one of the most profitable operations you can perform on your farm in any given year. A soil test is the only way to determine whether your soils contain adequate levels of plant essential nutrients such as phosphorus and potassium, and how soil parameters like pH can affect the availability of those nutrients.
With the tools and technology that exist today, there’s many ways to go about soil sampling. So, how do you decide on which sampling method best fits the variability within the soils on your farm? And how can you ensure that the sample results mean something?
The Basics
Whenever testing for plant nutrients, using the proper techniques will ensure that the analysis coming back from the lab accurately reflects what’s going on in the soil. Here’s how to get the best results:
- Be prepared to sample each field every 3-4 years, depending on your rotation.
- Soil can be sampled any time but is usually done in the fall after harvest. This gives time for analysis to come back from the lab and to make plans for the next crop. Try to sample at the same time of year each time to compare results and identify trends.
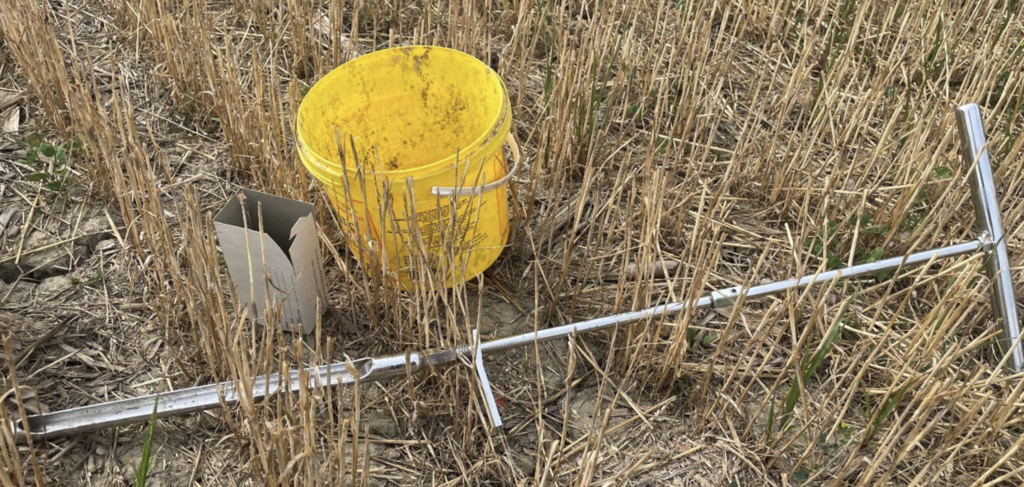
- Use a stainless steel probe to collect cores in a plastic pail. Avoid galvanized metals, as they can contaminate the sample and affect the results.
- Sample to the correct depth. For most nutrients, that’s a 15cm (6in.) depth, to reflect the depth where the majority of our plant nutrients lie. Mobile nutrients like nitrogen (N) or sulphur (S) may require a deeper sample to 30cm (12in.) and are generally done as a separate operation.
- Ensure you have a representative sample. Collect a minimum of 20 cores from your sampling area to mix. Remove stones and crop residues, and then sub-sample approximately 500 gms (~1 lb) to send to the lab.
- Avoid starter bands. For striptill systems, take 1 out of every 4 or 5 from the striptill zone.
- Identify the variability in your field and try to match this as best as possible through your sampling. We’ll break this out a bit further below.
- Send the sample to an OMAFRA-accredited lab. OMAFRA’s lab accreditation program ensures that the analysis your samples undergo have been demonstrated to fit Ontario soils, and that the results can be used for proper fertilizer recommendations.
What causes variability on your Farm
Every field has variability, even the flattest clay soils. To get the best results soil sampling, it’s important to identify how variable your field is, and how you can manage this variability in the long run.
So, what causes things like soil texture, nutrient levels, and water holding capacity to vary in our soils? Much of it has to do with the way the soils were formed – things like:
- Parent material (geological material that forms soils (e.g. rocks, sand, silt, clay, decomposed organic matter))
- Topography and natural drainage
- Climate
- Time
As well as management factors that humans have control over:
- Tillage
- Fertilization
- Crop Residue
- Wheel Traffic/Compaction
Your knowledge of the field’s variability is the most important aspect to deciding how to sample your field. Separating the above- and below-average areas of your field can often lead to better sample analysis and improved fertilization practice. Sampling problem areas separate from the rest is important to recognize the nutrient interactions that may be at play.
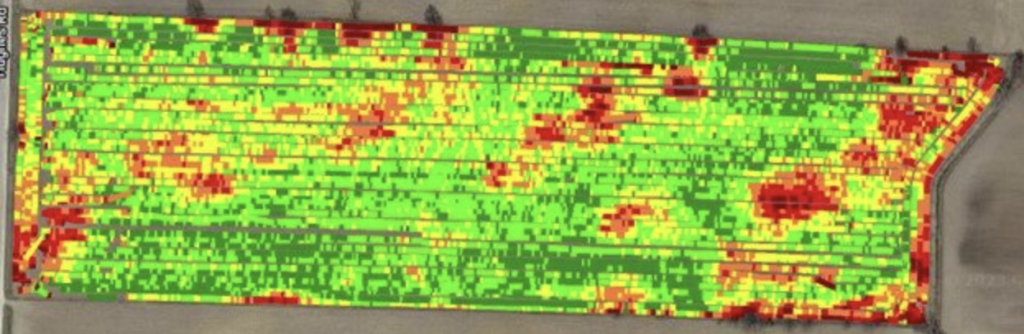
In fields with high variability, it can be difficult to identify the best method for soil sampling. Bare field images, crop health or NDVI imagery, yield data, and elevation data can be used to help understand the spatial differences within the soil. The more layers of data you have the better, to help determine the most appropriate sampling method.
A good soil sample is representative of the area where it is taken and gives an indication of crop yield response to certain nutrients. Mixing high and low yielding areas together in a single sample can lead to under- or over-fertilization of those areas, which can cost the farm in lost yield potential or increased input costs.
What’s the Best Soil Sampling Method for my Farm?
Soil sampling can be done a number of different ways, but there are generally 4 different methods to determine a fields fertility analysis:
Composite or bulk sampling
- Collecting 1 composite sample from a relatively large area of field, up to 10 ha (25 ac).
- Appropriate where there’s little variability present in the field, or economic return to fertilization is low.
- Pro tip: break larger fields apart into areas representing different soil types or topography that can be managed differently if required.
Point or grid sampling
- Using a georeferenced grid overlaid on a map, and collecting 1 composite sample to represent a point in the field. Points are often chosen to represent 0.4-2 ha (1-5 ac) of the field.
- Values between points are extrapolated using mapping software.
- Appropriate where more variability exists in the field, or expecting to use a variable rate (VR) prescription for lime or fertilizer application.
- Pro tip: ensure that the sample point is representative of the area it’s taken.
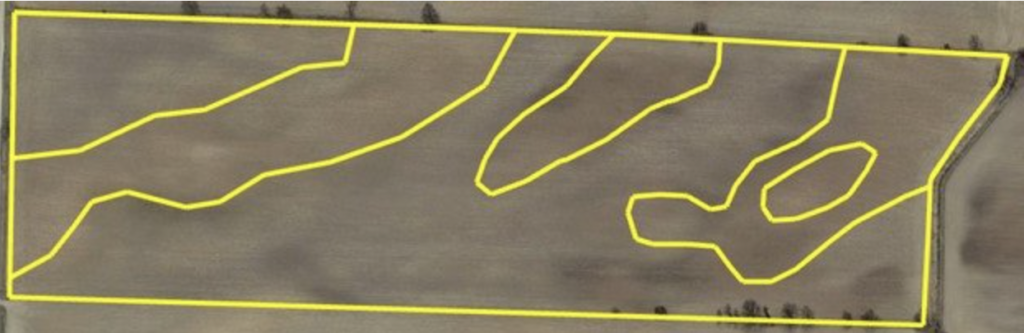
Zone or polygon sampling
- Using pre-identified management zones for a field, collecting 1 composite sample to represent a zone. Zones can vary in size, depending on how the field lies.
- Allows sampling to follow natural field patterns occurring in the soil.
- Appropriate where variability exists in the field, and when there is quality data available for zone creation, either by hand or using mapping software.
- Pro tip: use multiple years and/or sources of data for zone creation to eliminate bias of wet or dry years.
Sensor-based Sampling
- Using vehicle mounted sensors to measure parameters such as electrical conductivity, topography, soil type and texture, or natural radiation from the soil.
- Used in conjunctions with traditional lab analysis for testing, and often other layers of data for the field (e.g. water holding capacity, topsoil depth, or slope position).
- Sensor-based methods include, but are not limited to:
- GroundWorks
- SoilOptix
- SWAT Maps
- Veris
- Use of sensors and mapping software can show higher degrees of variability inherent within relatively small spatial distances in fields.
- Appropriate for use in fields with high or extreme variability, and for extensive Variable Rate (VR) capabilities with lime, fertilizer, seeding, and more.
- Pro tip: talk to your Certified Crop Advisor or agronomist to see how these technologies line up with your nutrient fertility goals.
The Bottom Line
Soil sampling is the first step in creating the fertility plan for your next crop. Make sure it’s done correctly and accurately by matching the soil variation with the sampling method that best maps it out. You can then use the sample results to apply lime and fertilizers in the right areas at the right rates. Nutrient fertility planning is crucial to maximize productivity and profitability in your crop.
Weather Data – July 3-9 2023
| Location | Year | Highest Temp (°C) | Lowest Temp (°C) | Rain (mm) | Rain (mm) April 1st | GDD 0C April 1st | GDD 5C April 1st | CHU May 1st |
| Harrow | 2023 | 30.3 | 15.9 | 40.9 | 244 | 1480 | 991 | 1413 |
| 2022 | 31.4 | 14.4 | 11.1 | 220 | 1521 | 1053 | 1563 | |
| 10 YR Norm (11 – 20) | 28.6 | 16.5 | 35.3 | 324 | 1505 | 1007 | 1548 | |
| Ridgetown | 2023 | 30.2 | 13.1 | 46.3 | 328 | 1404 | 924 | 1313 |
| | 2022 | 30.5 | 10.4 | 4.9 | 181 | 1423 | 963 | 1430 |
| | 10 YR Avg. (2011-20) | 29.4 | 14.3 | 24.0 | 262 | 1410 | 917 | 1437 |
| London | 2023 | 30.1 | 11.7 | 24.7 | 296 | 1398 | 918 | 1312 |
| | 2022 | 28.9 | 10.9 | 7.7 | 198 | 1371 | 921 | 1374 |
| | 10 YR Avg. (2011-20) | 29.1 | 14.6 | 22.7 | 289 | 1387 | 898 | 1416 |
| Brantford | 2023 | 30.8 | 11.3 | 46.4 | 270 | 1389 | 908 | 1306 |
| | 2022 | 29.4 | 9.4 | 6.8 | 187 | 1372 | 911 | 1334 |
| Welland | 2023 | 30.6 | 11.9 | 23.5 | 263 | 1393 | 907 | 1298 |
| | 2022 | 27.8 | 11.4 | 1.9 | 193 | 1413 | 943 | 1412 |
| | 10 YR Avg. (2011-20) | 28.6 | 15.2 | 12.6 | 281 | 1389 | 899 | 1417 |
| Elora | 2023 | 30.1 | 10.6 | 20.0 | 253 | 1279 | 820 | 1199 |
| | 2022 | 25.5 | 8.8 | 7.0 | 195 | 1250 | 808 | 1235 |
| | 10 YR Avg. (2011-20) | 27.8 | 12.6 | 20.2 | 282 | 1218 | 751 | 1245 |
| Mount Forest | 2023 | 27.0 | 7.6 | 21.3 | 233 | 1139 | 715 | 1029 |
| | 2022 | 29.5 | 7.1 | 8.4 | 188 | 1143 | 731 | 1105 |
| | 10 YR Avg. (2011-20) | 27.8 | 12.6 | 13.1 | 274 | 1199 | 736 | 1221 |
| Peterborough | 2023 | 31.5 | 8.9 | 1.9 | 205 | 1299 | 823 | 1186 |
| | 2022 | 26.6 | 6.5 | 6.2 | 218 | 1258 | 796 | 1245 |
| | 10 YR Avg. (2011-20) | 28.8 | 12.4 | 10.5 | 258 | 1253 | 777 | 1257 |
| Kemptville | 2023 | 33.9 | 16.4 | 0.5 | 246 | 1386 | 914 | 1281 |
| | 2022 | 26.5 | 8.8 | 9.4 | 314 | 1351 | 869 | 1347 |
| | 10 YR Avg. (2011-20) | 29.8 | 14.4 | 15.8 | 278 | 1315 | 840 | 1337 |
| Earlton | 2023 | 33.6 | 13.2 | 32.6 | 236 | 1177 | 753 | 1147 |
| | 2022 | 26.0 | 5.8 | 9.4 | 199 | 1109 | 695 | 1148 |
| | 10 YR Avg. (2011-20) | 28.4 | 11.0 | 18.6 | 233 | 1014 | 622 | 1075 |
| Sudbury | 2023 | 31.3 | 12.7 | 40.2 | 355 | 1188 | 765 | 1151 |
| | 2022 | 23.8 | 7.5 | 12.8 | 208 | 1111 | 689 | 1141 |
| | 10 YR Avg. (2011-20) | 28.2 | 12.1 | 19.6 | 259 | 1097 | 682 | 1154 |
| Thunder Bay | 2023 | 28.0 | 6.4 | 3.2 | 180 | 1026 | 624 | 1030 |
| | 2022 | 27.9 | 6.2 | 8.2 | 352 | 906 | 520 | 894 |
| | 10 YR Avg. (2011-20) | 27.8 | 10.4 | 25.7 | 261 | 933 | 530 | 943 |
| Fort Frances | 2023 | 26.9 | 1.7 | 36.7 | 190 | 1195 | 786 | 1241 |
| | 2022 | 27.2 | 4.2 | 18.1 | 395 | 973 | 589 | 1018 |
| | 10 YR Avg. (2011-20) | 27.9 | 10.7 | 25.8 | 250 | 1052 | 631 | 1093 |