
What to do with those stubble fields now? Consider BioStrip Till!
Winter wheat combining has almost wrapped up across the province after a challenging harvest due to persistent rainfall. There is a lot of enthusiasm for wheat across Ontario as yields were good to excellent and quality was good.
Now, what to do with the wheat stubble? If you have manure, now is the best time to apply it onto stubble fields, since they are drier and better able to tolerate the heavy manure application equipment. Summer manure applications need additional management to trap nitrogen. Tillage is one method and planting over-wintering cover crops to take up the nitrogen is another viable option.
Lots of fields get tilled even without the manure this time of year. Tillage can be very effective at creating a suitable seedbed for even germination, but why do it so far ahead of seeding the crop next spring? Full field tillage after wheat harvest increases soil erosion potential throughout the fall and winter and can stimulate a lot of weeds to germinate. Eroded fields require more tillage in the spring to prepare for planting. Both the erosion threat and weed issue can be addressed by seeding cover crops. The cover crop benefits increase greatly if either overwintered live or terminated late fall chemically without tillage. Also, despite the operational cost, direct seeding cover crops is the best method to ensure optimal germination and growth. Many use broadcast seeders and tillage to establish cover crops, which tends to be less effective.
The advantage of cover crops are: less tillage, there are living plants in the field to support soil biology, improved soil tilth and weeds are suppressed. This suppression of weeds following cereals is so much more important these days. With the continued increase in herbicide weed resistance, the continued fight with fleabane, and an even greater threat in water hemp being found in the province, we just cannot let those weeds grow and go to seed like we have in the past. The risk of getting more and broader resistance is just too great. In the past it was relatively easy to manage all those weed seeds added to the soil seed bank from stubble fields, but its significantly more of a problem today.
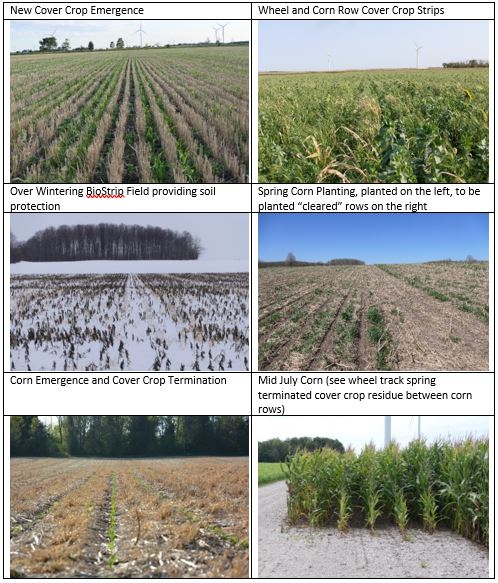
Some innovative farmers in Ontario have adopted a system that expands on the cover crop idea to get the benefits of tillage at planting: BioStrip Til! BioStrip till encompasses separate cover crop mixes that are planted in strips across the field. These strips alternate between “corn rows” and “wheel rows”. Cover crop species that winterkill are planted in the corn rows. In spring there is only some dead plant residue that can be notill planted or use a light “cleaning” of the row can be done to push that residue aside. In the wheel row, over-wintering species are chosen so that they are green in the spring and act to dry and warm the soil while supporting the weight of equipment better than worked ground. This system also offers a modified controlled traffic flow which reduces compaction in the corn row area. Once the crop is planted a normal burndown + residual herbicide program is applied to terminate the wheel row cover crops and provide season long weed control like other corn systems.
Note that the BioStrip Till system leaves the soil protected from erosion and degradation throughout the rotation because of the living cover crops following wheat harvest, wheat planted after soybean harvest, and corn residue left undisturbed following corn harvest. Soils are most susceptible to erosion and damage during the non-growing season portion of the year. Many acres across Ontario are not protected in their current system and BioStrip Till provides this protection beyond all the corn production benefits. (See Table 1).
Those making the system work are finding comparable yields to their conventional tillage neighbours with less effort. The system involves less tractors, less fuel, fewer passes, and less (no) tillage equipment. Equipped with a good corn planter, seed drill, sprayer, combine with high end straw chopper and a “row cleaner” you are all set. There is a “mindset” shift needed in our heads about what “normal” is because the BioStrip Till system going into winter would scare a lot of people because of how “chaotic” it appears but those who have changed their thinking are benefiting from this exciting system. Join the Fall BioStrip Till Tour on Friday, September 8, 2023, in Strathroy and Lucknow where you can see these systems in action. Farmers are welcome to attend either or both locations. See the flyer at https://bit.ly/Biostrip_Tour (that’s a “Biostrip_Tour”, if you’re typing it in).
Table 1. Sequence of BioStrip Till System
Weather Data – August 14 – 20, 2023
| Location | Year | Highest Temp (°C) | Lowest Temp (°C) | Rain (mm) | Rain (mm) April 1st | GDD 0C April 1st | GDD 5C April 1st | CHU May 1st |
| Harrow | 2023 | 24.9 | 10.8 | 68.6 | 451 | 2346 | 1652 | 2496 |
| 2022 | 27.9 | 13.4 | 17.8 | 374 | 2478 | 1796 | 2753 | |
| 10 YR Norm (11 – 20) | 26.7 | 13.7 | 20.5 | 448 | 2563 | 1825 | 2867 | |
| Ridgetown | 2023 | 25.4 | 8.7 | 28.9 | 459 | 2233 | 1548 | 2334 |
| | 2022 | 29.5 | 10.9 | 30.5 | 268 | 2340 | 1665 | 2541 |
| | 10 YR Avg. (2011-20) | 26.6 | 12.5 | 10.3 | 405 | 2412 | 1679 | 2670 |
| London | 2023 | 24.9 | 9.1 | 26.4 | 477 | 2216 | 1531 | 2322 |
| | 2022 | 29.2 | 12.9 | 12.6 | 306 | 2275 | 1610 | 2473 |
| | 10 YR Avg. (2011-20) | 26.3 | 12.7 | 18.0 | 422 | 2392 | 1663 | 2654 |
| Brantford | 2023 | 25.8 | 7.9 | 40.7 | 413 | 2199 | 1513 | 2297 |
| | 2022 | 30.0 | 12.5 | 3.1 | 270 | 2289 | 1613 | 2426 |
| Welland | 2023 | 25.7 | 11.4 | 34.2 | 442 | 2236 | 1544 | 2349 |
| | 2022 | 30.4 | 13.0 | 15.4 | 291 | 2343 | 1658 | 2556 |
| | 10 YR Avg. (2011-20) | 26.6 | 12.3 | 11.2 | 376 | 2407 | 1677 | 2675 |
| Elora | 2023 | 24.6 | 7.1 | 20.6 | 390 | 2034 | 1365 | 2113 |
| | 2022 | 29.6 | 10.5 | 4.4 | 228 | 2097 | 1433 | 2224 |
| | 10 YR Avg. (2011-20) | 25.3 | 10.9 | 20.4 | 422 | 2162 | 1446 | 2376 |
| Mount Forest | 2023 | 24.7 | 8.2 | 12.1 | 362 | 2036 | 1372 | 2126 |
| | 2022 | 28.3 | 10.9 | 3.6 | 310 | 2091 | 1434 | 2259 |
| | 10 YR Avg. (2011-20) | 24.9 | 11.9 | 23.6 | 435 | 2148 | 1440 | 2391 |
| Peterborough | 2023 | 27.1 | 11.0 | 6.3 | 408 | 2083 | 1402 | 2128 |
| | 2022 | 30.2 | 6.6 | 38.6 | 304 | 2110 | 1432 | 2245 |
| | 10 YR Avg. (2011-20) | 26.4 | 10.1 | 17.8 | 374 | 2196 | 1479 | 2382 |
| Kemptville | 2023 | 27.0 | 13.2 | 7.4 | 479 | 2217 | 1540 | 2299 |
| | 2022 | 31.3 | 9.9 | 0.2 | 406 | 2257 | 1559 | 2438 |
| | 10 YR Avg. (2011-20) | 27.4 | 12.0 | 35.0 | 423 | 2310 | 1595 | 2547 |
| Earlton | 2023 | 26.4 | 8.5 | 11.8 | 310 | 1889 | 1260 | 1993 |
| | 2022 | 28.2 | 10.6 | 31.2 | 326 | 1905 | 1276 | 2091 |
| | 10 YR Avg. (2011-20) | 23.7 | 10.5 | 19.7 | 360 | 1880 | 1248 | 2120 |
| Sudbury | 2023 | 25.7 | 7.3 | 14.4 | 473 | 1915 | 1287 | 2028 |
| | 2022 | 27.0 | 10.7 | 6.5 | 296 | 1928 | 1290 | 2143 |
| | 10 YR Avg. (2011-20) | 23.6 | 11.0 | 18.3 | 395 | 2012 | 1357 | 2276 |
| Thunder Bay | 2023 | 27.7 | 6.1 | 7.2 | 241 | 1737 | 1130 | 1858 |
| | 2022 | 28.7 | 7.6 | 23.2 | 445 | 1688 | 1087 | 1816 |
| | 10 YR Avg. (2011-20) | 24.1 | 9.0 | 12.5 | 363 | 1797 | 1153 | 1976 |
| Fort Frances | 2023 | 29.7 | 5.3 | 1.6 | 292 | 1899 | 1285 | 2057 |
| | 2022 | 27.5 | 6.0 | 21.6 | 555 | 1771 | 1173 | 1974 |
| | 10 YR Avg. (2011-20) | 25.1 | 8.6 | 12.3 | 367 | 1920 | 1258 | 2124 |
2 thoughts on “Crop Report – Week of August 23rd, 2023”
Comments are closed.