What Are Potential Impacts to Field Crops from Wildfire Smoke in 2023?
Smoke from northern Ontario and Quebec wildfires was prevalent across Ontario for several weeks in June and early July. While a smoky haze was often visible during these weeks (Fig. 1), the heaviest days carried a campfire-like smell and reportedly even reduced visibility in parts of Northern and Eastern Ontario.
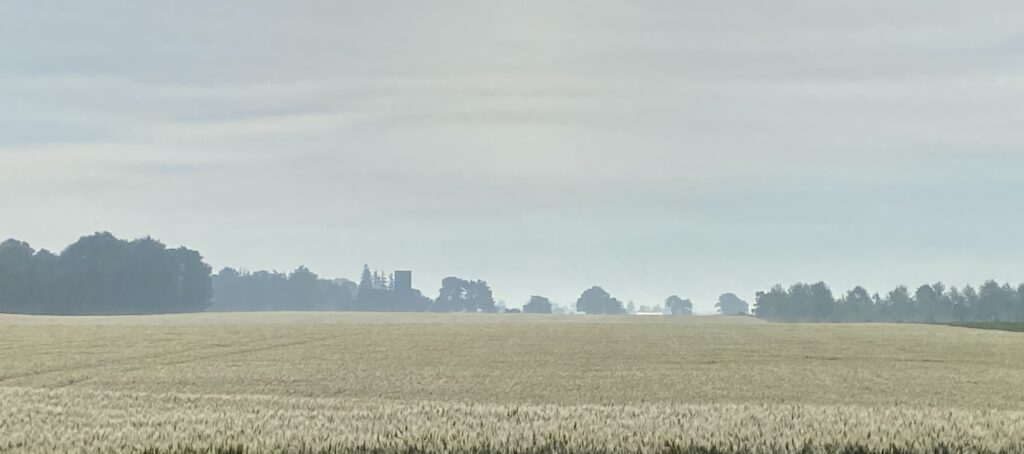
Figure 1. Smoky haze over a wheat field late June, early July in 2023.
What is the Impact of Wildfire Smoke on Field Crops?
A common question this year has been “what is the impact of wildfire smoke on field crops”? Given the random and infrequent nature of these smoke events, research is limited and it’s difficult to conduct controlled experiments to measure impacts directly.
In absence of research, one approach is to look at characteristics of smoke events (e.g., smoke levels, crop stages affected) to estimate what crop impacts may be (Jeschke, 2021). Several authors have outlined common themes for potential positive and negative impacts of wildfire smoke on crops (Table 1).
Table 1. Negative and Positive Impacts of Wildfire Smoke on Field Crops
| Negative Impacts | Positive Impacts |
| Reduced Light Availability | Diffuse Light |
| Ozone | Lower Leaf Temperatures |
| Ash Deposition |
Negative Impacts
Reduced Light Availability
Smoke particles reflect a portion of incoming solar radiation potentially reducing the amount available for photosynthesis at plant level.
How Much Does Wildfire Smoke Reduce Light?
Jeschke (2021) summarized results from a couple of research trials investigating light reductions during wildfire smoke in California which ranged from 4-11% over the period smoke was present. Data from Ohio suggested a 6-7% reduction during June/July when wildfire smoke was present compared to the same period for the previous 5 years (Lindsey, 2021).
How Does This Compare to Cloudy Weather?
For comparisons sake, Jeschke (2021) compared measurements of photosynthetically active radiation (PAR) for varying cloud covers relative to a sunny July day in Iowa.
- a partly cloudy day reduced PAR by 23%
- a cloudy day reduced PAR by 52%
- a rainy day reduced PAR by 62%
What are Yield Impacts for Reducing Light?
In corn, small amounts of shading can have limited yield impacts, but significant shading can impact yields. Amount of yield loss depends on crop stage. Yield impacts are minimal during vegetative stages and greatest during pollination and early grain fill (likely because kernel number and kernel fill is highly sensitive to photosynthate production at these times) (Jeschke, 2021).
The amount of light we receive may be greater than what plants require to optimize photosynthesis. Reducing light availability is expected to have a greater impact on C4 plants (corn, sorghum) as they have higher light saturation points (the point where additional light provides no more benefit for photosynthesis). Light quantity must be reduced a greater amount before it starts to impact photosynthesis in C3 plants (most other field crops grown in Ontario) (Lindsey, 2023).
Other Reduced Light Risks
If carbohydrate accumulation during grain fill is lower than normal, another potential risk could be increased remobilization from stalks to help fill grain, as can occur during years with other stresses (drought, disease/leaf area loss, N loss etc.). Compromised stalks can increase risks for stalk rots and/or lodging (Archontoulis and Licht, 2023; Jeschke, 2021).
Ozone
Ozone is produced when certain pollutants produced by wildfires react in the presence of sunlight. Ozone enters plants through stomata and damages plant tissues during respiration which can cause growth issues. Dicots (e.g., soybeans and other non-grasses) are thought to be more susceptible than monocots (e.g., grasses) possibly because injury symptoms may be more clearly observed, but yields can be reduced in both (Jeschke, 2021).
Ash Deposition
Crops that are in the vicinity of wildfires, could experience ash deposits on leaves and potentially block various amounts of light and photosynthesis (Lindsey, 2023).
Positive Impacts
Diffuse Light
Smoke particles scatter light which produces diffuse light (light received indirectly after bouncing off objects rather than directly from the sun). Diffuse light can penetrate deeper into crop canopies and provide light for photosynthesis to lower leaves which are shaded under sunny conditions. Because photosynthesis may not use all light provided (Lindsey, 2023) this may increase total photosynthesis in the crop canopy if the increase in total photosynthesis is greater than any decreases in light received from what is causing diffusion (cloud, smoke). Some greenhouses use diffuse covers to scatter light on sunny days for this purpose. Canopies with greater heights or leaf area indexes likely see the greatest benefits from diffuse light (Jeschke, 2021).
Lower Leaf Temperatures
Leaf temperatures are more related to light intensity than air temperature and lower light intensity can reduce leaf temperatures (Lindsey, 2023). This can reduce plants reliance on transpiration to cool leaves. Preserving moisture can be a benefit under sunny, hot and drought-stressed conditions.
Final Comments
There can be both potentially positive and negative impacts, but they are complex, depend on degree of smoke, crop growth stage, and potentially interact with each other (Jeschke, 2021). It’s difficult to put exact numbers on yield risks. While it can’t be said wildfire smoke has no impact, other factors such as drought or excess rainfall can have much more significant impacts on yields, and other areas of North America have been able to achieve record yields in years where wildfire smoke was apparent during parts of the growing season (Archontoulis and Licht, 2023).
In Ontario, on the favourable side this year, most smoke was encountered during the vegetative stages for crops like corn and soybeans, when impacts from potential negative factors are likely much less.
References
Archontoulis, A. and M. Licht. 2023. Wildfire smoke impacts on crop production. Iowa State University. https://crops.extension.iastate.edu/blog/mark-licht-sotirios-archontoulis/wildfire-smoke-impacts-crop-production. (Accessed 30 Aug. 2023).
Jeschke, M. 2021. Is Smoke from Wildfires Affecting Crop Yields? Pioneer. https://www.pioneer.com/us/agromomy /wildfires-crop-yields.html. (Accessed 30 Aug. 2023).
Lindsey, A., L. Lindsey and A. Wilson. 2021. Hazy days… How does light influence corn and soybean? Ohio State University. https://agcrops.osu.edu/newsletter/corn-newsletter/2021-26/hazy-days%E2%80%A6how-does-light-influence-corn-and-soybean. (Accessed 30 Aug. 2023).
Lindsey, A., L. Lindsey and O. Ortez. 2023. How could the haze of wildfires affect crop growth? Ohio State University. https://agcrops.osu.edu/newsletter/corn-newsletter/2023-21/how-could-haze-wildfires-affect-crop-growth. (Accessed 30 Aug. 2023).
Weather Data – August 21-27, 2023
| Location | Year | Highest Temp (°C) | Lowest Temp (°C) | Rain (mm) | Rain (mm) April 1st | GDD 0C April 1st | GDD 5C April 1st | CHU May 1st |
| Harrow | 2023 | 28.7 | 12.3 | 119.2 | 570 | 2488 | 1759 | 2675 |
| 2022 | 27.4 | 11.7 | 3.1 | 377 | 2624 | 1906 | 2933 | |
| 10 YR Norm (11 – 20) | 26.7 | 15.6 | 19.2 | 467 | 2712 | 1939 | 3055 | |
| Ridgetown | 2023 | 26.9 | 9.5 | 36.2 | 495 | 2367 | 1647 | 2501 |
| | 2022 | 28.9 | 8.7 | 0.3 | 269 | 2480 | 1771 | 2709 |
| | 10 YR Avg. (2011-20) | 26.4 | 13.7 | 18.6 | 424 | 2553 | 1786 | 2845 |
| London | 2023 | 25.7 | 10.1 | 63.1 | 540 | 2346 | 1626 | 2484 |
| | 2022 | 28.4 | 10.4 | 1.6 | 307 | 2417 | 1716 | 2645 |
| | 10 YR Avg. (2011-20) | 25.9 | 13.5 | 17.0 | 439 | 2531 | 1767 | 2826 |
| Brantford | 2023 | 25.9 | 10.4 | 23.7 | 437 | 2329 | 1608 | 2460 |
| | 2022 | 29.6 | 10.3 | 5.9 | 276 | 2434 | 1723 | 2598 |
| Welland | 2023 | 26.2 | 11.2 | 44.0 | 486 | 2370 | 1643 | 2518 |
| | 2022 | 28.4 | 12.4 | 2.2 | 294 | 2488 | 1768 | 2736 |
| | 10 YR Avg. (2011-20) | 25.9 | 12.9 | 12.8 | 389 | 2547 | 1782 | 2849 |
| Elora | 2023 | 24.0 | 9.1 | 38.8 | 429 | 2154 | 1450 | 2258 |
| | 2022 | 27.8 | 9.0 | 15.6 | 243 | 2229 | 1530 | 2382 |
| | 10 YR Avg. (2011-20) | 24.5 | 11.5 | 11.8 | 434 | 2289 | 1538 | 2532 |
| Mount Forest | 2023 | 23.3 | 7.2 | 21.2 | 383 | 2151 | 1452 | 2265 |
| | 2022 | 26.7 | 8.6 | 25.4 | 336 | 2221 | 1529 | 2416 |
| | 10 YR Avg. (2011-20) | 24.1 | 12.2 | 10.9 | 446 | 2276 | 1533 | 2549 |
| Peterborough | 2023 | 24.9 | 7.7 | 2.1 | 410 | 2206 | 1490 | 2279 |
| | 2022 | 28.1 | 7.8 | 11.5 | 316 | 2243 | 1531 | 2406 |
| | 10 YR Avg. (2011-20) | 25.9 | 9.7 | 15.2 | 389 | 2322 | 1571 | 2533 |
| Kemptville | 2023 | 26.0 | 10.1 | 2.2 | 481 | 2342 | 1630 | 2452 |
| | 2022 | 29.2 | 8.8 | 22.3 | 428 | 2395 | 1663 | 2610 |
| | 10 YR Avg. (2011-20) | 25.0 | 12.1 | 13.0 | 436 | 2440 | 1690 | 2707 |
| Earlton | 2023 | 24.5 | 4.9 | 1.5 | 311 | 1997 | 1333 | 2117 |
| | 2022 | 26.0 | 9.6 | 0.5 | 327 | 2023 | 1360 | 2230 |
| | 10 YR Avg. (2011-20) | 23.4 | 8.9 | 25.9 | 386 | 1991 | 1325 | 2252 |
| Sudbury | 2023 | 23.8 | 7.3 | 4.5 | 477 | 2029 | 1366 | 2165 |
| | 2022 | 26.1 | 11.3 | 7.8 | 303 | 2055 | 1382 | 2298 |
| | 10 YR Avg. (2011-20) | 23.3 | 10.7 | 28.2 | 423 | 2130 | 1440 | 2420 |
| Thunder Bay | 2023 | 25.0 | 3.4 | 24.2 | 266 | 1849 | 1206 | 1991 |
| | 2022 | 27.6 | 11.1 | 8.7 | 453 | 1818 | 1182 | 1974 |
| | 10 YR Avg. (2011-20) | 23.5 | 8.8 | 20.5 | 384 | 1909 | 1230 | 2108 |
| Fort Frances | 2023 | 26.3 | 5.7 | 15.3 | 307 | 2014 | 1365 | 2194 |
| | 2022 | 28.7 | 8.4 | 16.5 | 571 | 1900 | 1266 | 2127 |
| | 10 YR Avg. (2011-20) | 24.1 | 8.1 | 22.1 | 389 | 2033 | 1336 | 2256 |
3 thoughts on “Crop Report – Week of August 28th, 2023”
Comments are closed.