Identifying and Addressing Soil Structure Challenges
A well-structured soil improves water infiltration, air exchange, rooting, and ultimately crop yield. On the other hand, a cloddy, dense, or compacted soil may result in ponding, nutrient losses, and restricted root systems. Poor soil structure contributes to lower crop yields, especially in seasons that are either too dry or too wet.
In this article, we will explore how to identify soil structure challenges and how to address them through management.
What does good soil structure look like?
The quality of soil structure can be evaluated quickly in-field using a shovel or spade. A soil with good structure should break up easily into relatively small aggregates that are rounded and have plenty of pores and roots within them (Figure 1a). A soil with poor structure will be more difficult to break apart into small pieces and will have sharp angles and very few pores and roots (Figure 1b).
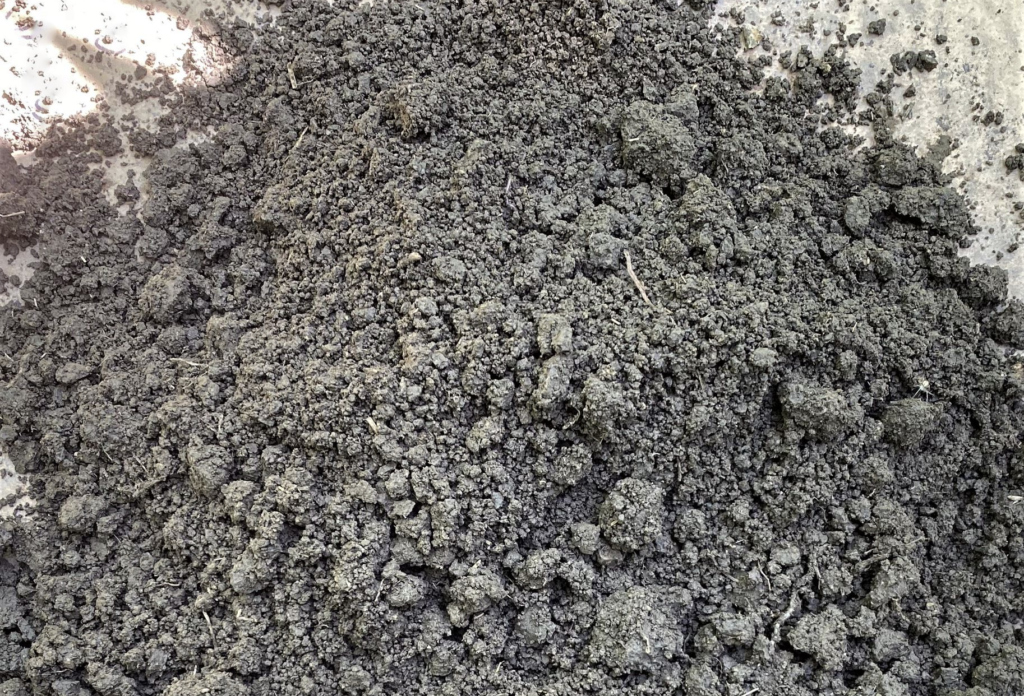
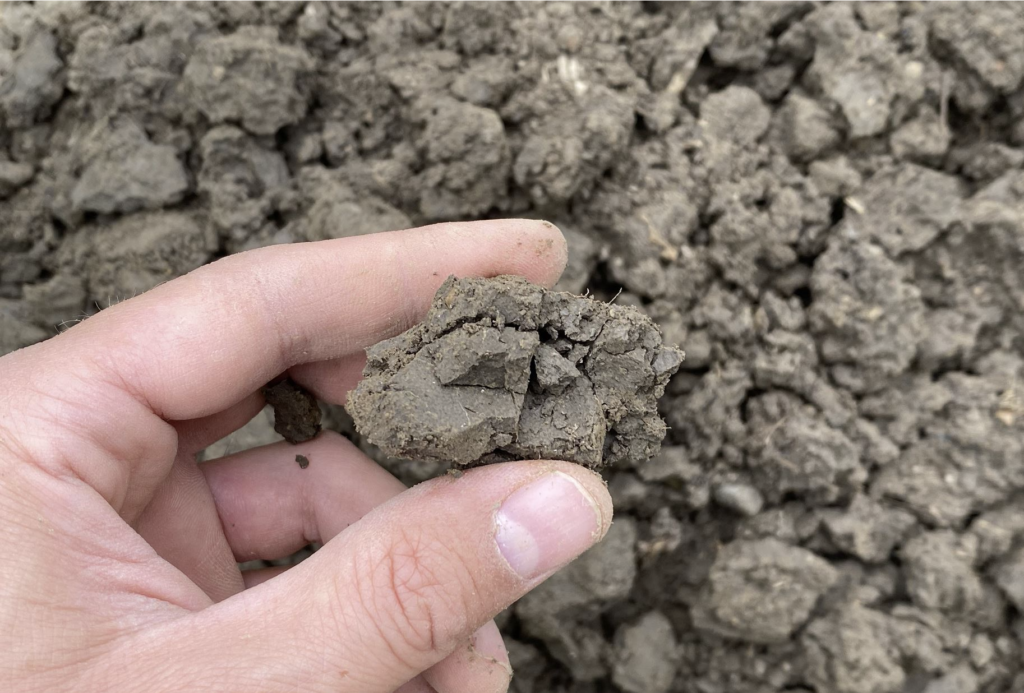
Figure 1. Good soil structure (a, left) vs. poor soil structure (b, right).
Soil structure changes with depth
In most cases, soil structure will be best within the top two to three inches, as this is the zone of greatest root concentration and biological activity. Soil typically becomes denser below that zone. In soils with more living roots (e.g., perennial forages) and a history no till or shallow tillage, the soil below the top few inches, while firm, will also often have good porosity and rounded aggregates – both signs of good soil structure.
Regardless of current tillage practices, soils in most cropped fields break apart along so-called “tillage layers”, which occur at the depths of past primary and secondary tillage. A tillage layer would only be considered a tillage pan if it restricts water movement and root growth.
Observations from Ontario corn fields in 2023
Using a method called the Visual Evaluation of Soil Structure (VESS), OMAFRA soil management specialists scored soil across a variety of corn fields this season with varying tillage and cropping practices. Below are a couple of key observations.
Cropping practices matter:
The best soil structure was observed in fields with perennial forages in rotation and in those with reduced tillage used alongside winter wheat and cover crops. Even in soils that had tillage layers or dense soil below the top few inches, root channels from prior crops in such fields helped corn roots access deeper soil. Taproot species such as alfalfa, brassicas, and some clovers assist with creating vertical pores, while fibrous-rooted plants such as grasses improve the tilth of the top few inches.
Compaction is a common issue:
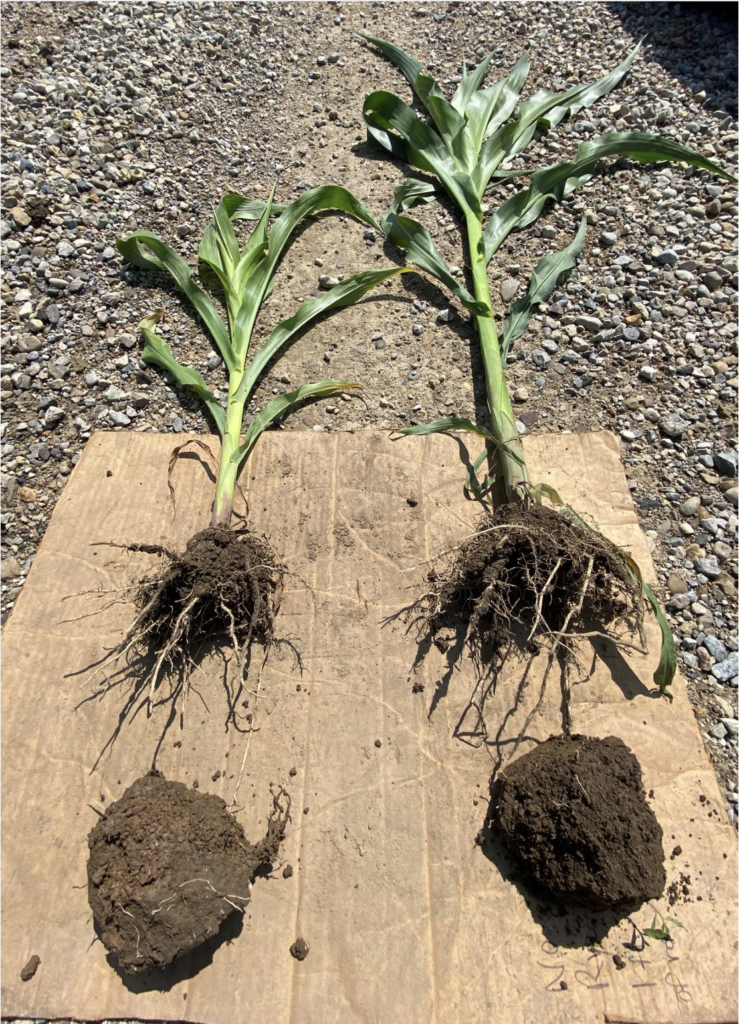
Although ample rainfall lessened its impact by enabling easier rooting in many corn fields this season, soil compaction was observed at several sites. One striking example showed the impact of trafficking soil before it was fit, with corn less than two-thirds the height of normal where a manure tanker ran in spring ahead of planting (Figure 2). Corn roots growing in compacted soil are typically thicker and have fewer fine lateral roots. Compaction can occur right up to the soil surface – caused by contact pressure – or into the subsoil – often due to a high axle load; either way, it restricts normal root development and lowers yield.
Evaluating soil structure on your own
Getting a sense of soil structure doesn’t need to be difficult. To assess the topsoil, simply grab a spade and dig out the top 6-8 inches in a block, leaving one face undisturbed. Look at layers that exist in the topsoil and gently break the soil apart into clumps. Are large pieces of soil easy to break apart with one hand or difficult? Do smaller aggregates look rounded or have sharp, angular corners? And when you look closely, do you see lots of little holes (pores) or does the soil look solid?
For a more systematic approach, use the Visual Evaluation of Soil Structure, which is described in text and by video on Field Crop Newshttps://fieldcropnews.com/2022/08/visual-evaluation-of-soil-structure/. And to identify subsoil compaction, use a tile probe or even a marking flag under moist field conditions to feel for resistance as you push down slow and steady.
Improving soil structure
Practices that contribute to good soil structure include: a crop rotation with small grains (and perennials if possible); reduced tillage, since tillage breaks down soil aggregates; addition of organic amendments; retention of crop residue; and the use of cover crops. Avoiding trafficking fields when conditions are not fit, utilizing newer tire technology, and the installation of automated deflation/inflation systems are all strategies that help prevent soil compaction.
These best management practices work together to enhance water infiltration, crop rooting, and equipment carrying capacity – all by improving soil structure.
Weather Data – July 31 – August 6 2023
| Location | Year | Highest Temp (°C) | Lowest Temp (°C) | Rain (mm) | Rain (mm) April 1st | GDD 0C April 1st | GDD 5C April 1st | CHU May 1st |
| Harrow | 2023 | 27.2 | 13.0 | 14.2 | 358 | 2084 | 1455 | 2170 |
| 2022 | 31.6 | 18.0 | 34.0 | 336 | 2191 | 1578 | 2394 | |
| 10 YR Norm (11 – 20) | 26.9 | 16.3 | 20.8 | 408 | 2267 | 1599 | 2496 | |
| Ridgetown | 2023 | 27.4 | 11.0 | 5.8 | 424 | 1978 | 1358 | 2020 |
| | 2022 | 31.8 | 15.2 | 18.7 | 230 | 2066 | 1461 | 2211 |
| | 10 YR Avg. (2011-20) | 26.3 | 13.7 | 21.3 | 379 | 2132 | 1470 | 2325 |
| London | 2023 | 27.8 | 10.5 | 15.5 | 425 | 1969 | 1349 | 2016 |
| | 2022 | 30.9 | 13.2 | 31.8 | 263 | 1998 | 1403 | 2134 |
| | 10 YR Avg. (2011-20) | 26.7 | 14.2 | 27.6 | 382 | 2112 | 1454 | 2308 |
| Brantford | 2023 | 27.0 | 9.3 | 3.7 | 359 | 1954 | 1333 | 1128 |
| | 2022 | 31.8 | 12.4 | 18.1 | 249 | 2005 | 1399 | 2085 |
| Welland | 2023 | 28.0 | 12.4 | 14.6 | 393 | 1980 | 1353 | 2028 |
| | 2022 | 30.2 | 13.0 | 10.7 | 274 | 2056 | 1441 | 2206 |
| | 10 YR Avg. (2011-20) | 27.1 | 14.4 | 17.8 | 350 | 2123 | 1464 | 2325 |
| Elora | 2023 | 27.3 | 8.3 | 26.2 | 361 | 1808 | 1204 | 1839 |
| | 2022 | 30.2 | 10.5 | 24.2 | 221 | 1834 | 1241 | 1911 |
| | 10 YR Avg. (2011-20) | 25.2 | 11.9 | 26.0 | 378 | 1906 | 1260 | 2065 |
| Mount Forest | 2023 | 26.3 | 8.0 | 11.6 | 337 | 1807 | 1208 | 1847 |
| | 2022 | 30.3 | 12.8 | 39.9 | 300 | 1838 | 1252 | 1954 |
| | 10 YR Avg. (2011-20) | 24.9 | 12.5 | 21.9 | 388 | 1888 | 1250 | 2069 |
| Peterborough | 2023 | 27.4 | 8.7 | 27.5 | 372 | 1836 | 1220 | 1825 |
| | 2022 | 31.1 | 9.4 | 2.7 | 265 | 1850 | 1242 | 1948 |
| | 10 YR Avg. (2011-20) | 27.1 | 12.0 | 23.8 | 344 | 1937 | 1291 | 2073 |
| Kemptville | 2023 | 26.5 | 7.9 | 5.1 | 376 | 1961 | 1350 | 1981 |
| | 2022 | 32.8 | 9.4 | 16.8 | 402 | 1981 | 1354 | 2108 |
| | 10 YR Avg. (2011-20) | 27.6 | 13.5 | 22.7 | 361 | 2032 | 1389 | 2209 |
| Earlton | 2023 | 26.0 | 6.5 | 7.6 | 274 | 1667 | 1103 | 1730 |
| | 2022 | 30.2 | 8.3 | 13.6 | 290 | 1659 | 1100 | 1803 |
| | 10 YR Avg. (2011-20) | 24.3 | 10.2 | 23.0 | 322 | 1642 | 1080 | 1834 |
| Sudbury | 2023 | 25.2 | 6.7 | 3.9 | 441 | 1695 | 1132 | 1765 |
| | 2022 | 27.0 | 12.6 | 22.1 | 279 | 1669 | 1102 | 1829 |
| | 10 YR Avg. (2011-20) | 25.1 | 12.4 | 25.3 | 354 | 1761 | 1177 | 1969 |
| Thunder Bay | 2023 | 30.9 | 10.0 | 0.3 | 212 | 1518 | 976 | 1607 |
| | 2022 | 27.6 | 10.0 | 8.4 | 418 | 1441 | 910 | 1527 |
| | 10 YR Avg. (2011-20) | 26.1 | 9.5 | 17.4 | 335 | 1555 | 982 | 1688 |
| Fort Frances | 2023 | 30.7 | 8.0 | 1.6 | 255 | 1684 | 1135 | 1809 |
| | 2022 | 26.4 | 6.4 | 10.4 | 533 | 1515 | 986 | 1670 |
| | 10 YR Avg. (2011-20) | 25.5 | 8.5 | 13.2 | 332 | 1679 | 1087 | 1838 |
2 thoughts on “Crop Report – Week of August 7th, 2023 ”
Comments are closed.