Bacterial infections in dry beans
Growing conditions this season have been ideal for certain bacterial diseases. Adzuki beans in a few different regions are exhibiting symptoms of bacterial brown spot (BBS), and in some cases the injury is severe. Symptoms on leaves appear as small necrotic lesions with a yellow margin (Figure 1). As symptoms advance the yellow margins may not be visible and whole leaves will be tattered, brown, and dead (Figure 2). Pods have water-soaked lesions that may turn black. Some pods may have lesions near the top of the pod, which can weaken the attachment causing pods to drop off. Symptoms have progressed very rapidly in the past month. In severe cases the plants may die before they mature, and seeds will not continue to mature which results in a high percentage of small seed.
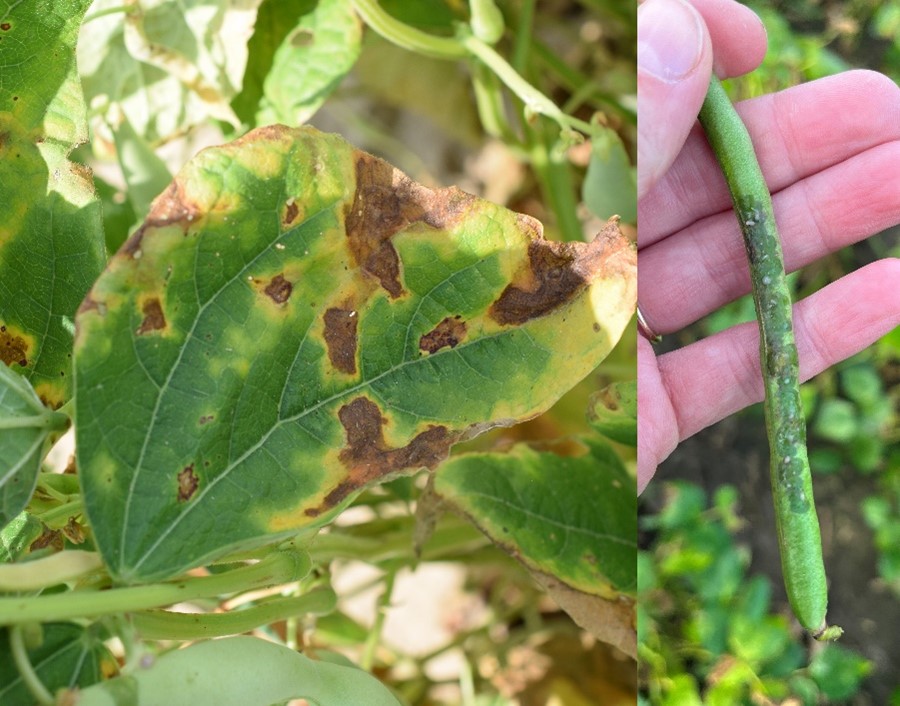
Figure 1. Bacterial brown spot symptoms in dry beans. Credit: O. Wally, AAFC
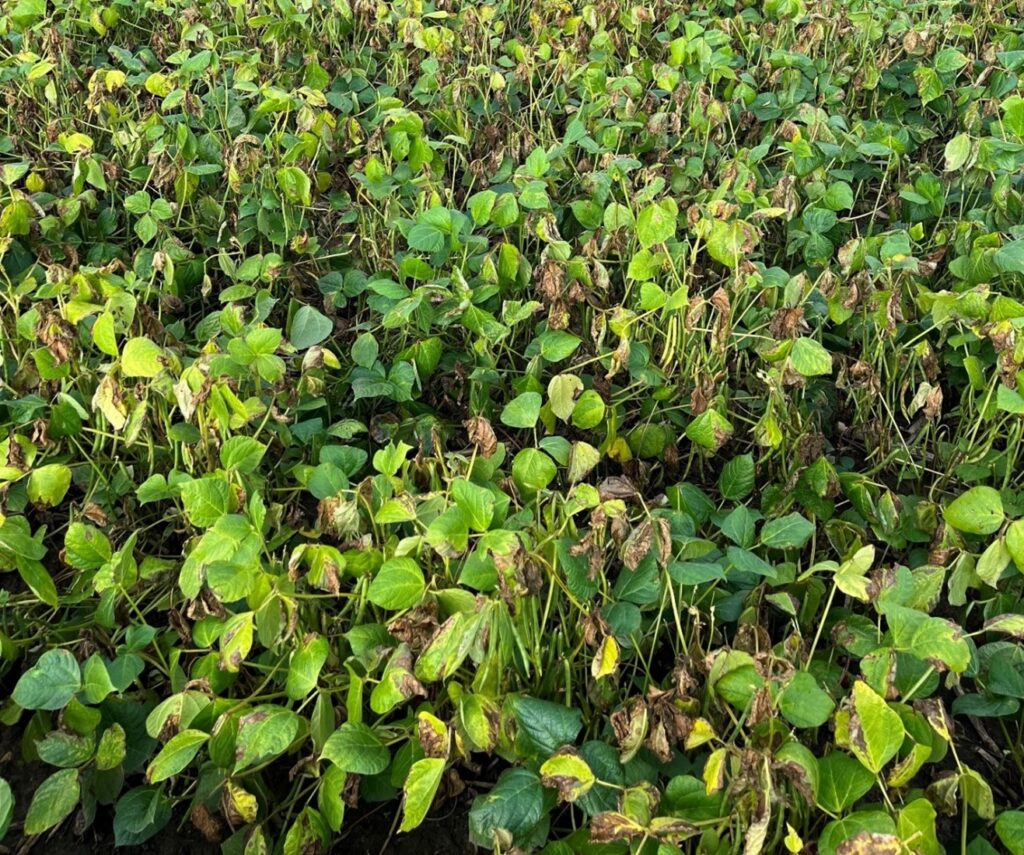
Figure 2. Severe BBS infection in adzuki beans with symptoms visible in 60% of the field and worsening over time.
The symptoms of BBS are very similar to those of common bacterial blight (CBB), although these diseases are caused by different organisms. Recent research shows that varieties with resistance to CBB may show some resistance to BBS. However, adzuki beans do not carry any resistance and seem to be highly susceptible to brown spot. A key difference between the two diseases is that BBS has many more hosts in Ontario, including corn, wheat, barley, clover, apple, and lilac. This increases its ability to survive locally and increases sources of inoculum.
Both bacterial brown spot and common bacterial blight could be present on seed, but adzuki seed is primarily grown in arid regions (Idaho) which reduces the likelihood of bacteria on the seed. Growing conditions play an important role in disease development. Both types of bacteria are more prevalent with high moisture and humidity, but BBS thrives with cooler conditions compared to CBB. In 2014 there were severe cases of BBS in adzuki, and environmental conditions in 2023 have been similar to 2014.
Bacterial blight has also been observed in soybeans in the past month. While the bacteria species that causes this disease in soybeans is different than for BBS in dry beans, there are similarities between these diseases. The leaf symptoms are similar in soybeans – necrotic spot with a yellow margin – but the lesions are typically smaller (Figure 3). Bacteria that are present in the field do not travel around much, but infection is more likely to occur after hail or rainstorms. The bacteria move when water runs through a field, which is why there are strips of browning plants along the side of hills and in low areas of infected adzuki fields. While bacterial blight symptoms have been noted in soybeans, the disease is generally not a concern in Ontario and is unlikely to result in yield loss, especially when observed this late in the season. BBS in adzuki beans, on the other hand, can cause extensive injury, high levels of dockage and/or small seed and yield loss. In 2014 there were cases of greater than 30% dockage from small, shriveled seed.
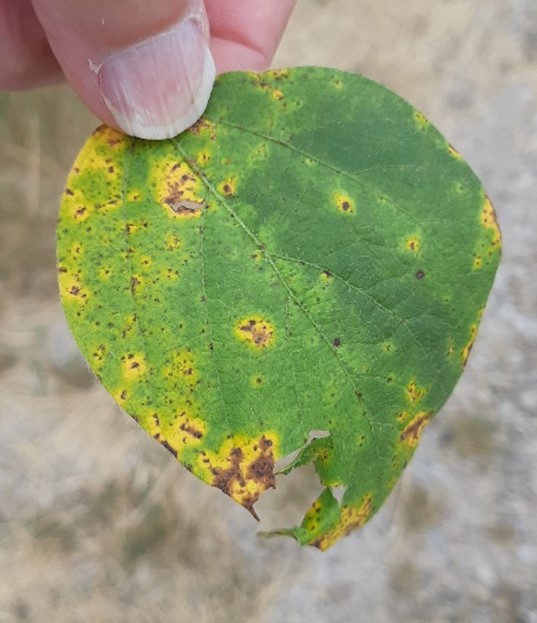
Figure 3. Bacterial blight symptoms in soybeans. Credit: D. Cowan
Managing bacterial disease
Clean certified seed is the best way to manage the risk of yield loss from bacterial disease. Aside from starting with clean seed, there is really no way to manage bacterial disease observed in bean fields. Adzuki beans should be monitored through maturity and sprayed with pre-harvest herbicide at the typical timing. Do not spray or harvest early in an attempt to salvage yield as this could contribute to increased dockage and pick (defective and off-colour beans).
Where adzuki fields have severe bacterial infections, efforts should be made to control volunteer beans growing in the field as much as possible to prevent ongoing hosting of the disease. Burying plant residue can help mitigate BBS from surviving on residue, because the bacteria require oxygen for metabolism. If dry beans are planned in the rotation within the next few years, corn and cereals can also host the disease and residue of those crops should also be buried or baled and removed if possible. Environmental conditions are key, so with hope the conditions will not be ideal for BBS during the next adzuki crop.
Bacterial diseases in dry beans and soybeans are not suppressed or controlled by fungicides. Foliar copper products are marketed for management of bacterial disease, but they require multiple applications and are not very effective.
Weather Data – September 4 – 10, 2023
| Location | Year | Highest Temp (°C) | Lowest Temp (°C) | Rain (mm) | Rain (mm) April 1st | GDD 0C April 1st | GDD 5C April 1st | CHU May 1st |
| Harrow | 2023 | 30.8 | 11.9 | 10.4 | 580 | 2758 | 1959 | 3005 |
| 2022 | 26.5 | 9.2 | 0.0 | 387 | 2916 | 2128 | 3298 | |
| 10 YR Norm (11 – 20) | 23.9 | 10.8 | 12.0 | 504 | 2974 | 2131 | 3381 | |
| Ridgetown | 2023 | 30.0 | 11.8 | 4.6 | 504 | 2629 | 1839 | 2815 |
| | 2022 | 28.7 | 8.3 | 0.0 | 277 | 2770 | 1990 | 3062 |
| | 10 YR Avg. (2011-20) | 24.2 | 8.6 | 12.8 | 457 | 2803 | 1965 | 3148 |
| London | 2023 | 30.6 | 13.7 | 1.3 | 545 | 2608 | 1818 | 2799 |
| | 2022 | 28.3 | 10.2 | 0.0 | 318 | 2697 | 1927 | 2989 |
| | 10 YR Avg. (2011-20) | 23.9 | 9.4 | 19.3 | 482 | 2775 | 1942 | 3123 |
| Brantford | 2023 | 31.3 | 13.7 | 4.2 | 445 | 2590 | 1799 | 2770 |
| | 2022 | 28.0 | 10.0 | 0.9 | 287 | 2709 | 1928 | 2929 |
| Welland | 2023 | 31.9 | 15.1 | 16.9 | 505 | 2648 | 1851 | 2856 |
| | 2022 | 26.6 | 11.7 | 48.7 | 365 | 2762 | 1971 | 3074 |
| | 10 YR Avg. (2011-20) | 23.8 | 9.3 | 21.9 | 431 | 2795 | 1960 | 3151 |
| Elora | 2023 | 31.4 | 11.7 | 8.0 | 444 | 2402 | 1628 | 2547 |
| | 2022 | 28.6 | 9.1 | 0.0 | 254 | 2491 | 1723 | 2696 |
| | 10 YR Avg. (2011-20) | 22.8 | 6.6 | 17.6 | 476 | 2508 | 1687 | 2788 |
| Mount Forest | 2023 | 30.5 | 10.9 | 13.4 | 405 | 2396 | 1627 | 2550 |
| | 2022 | 27.1 | 8.8 | 0.0 | 374 | 2481 | 1719 | 2733 |
| | 10 YR Avg. (2011-20) | 22.0 | 7.6 | 10.6 | 489 | 2497 | 1685 | 2810 |
| Peterborough | 2023 | 31.4 | 10.8 | 0.8 | 411 | 2464 | 1677 | 2577 |
| | 2022 | 27.5 | 8.1 | 0.0 | 323 | 2496 | 1713 | 2703 |
| | 10 YR Avg. (2011-20) | 23.2 | 5.6 | 18.1 | 427 | 2539 | 1718 | 2783 |
| Kemptville | 2023 | 32.5 | 10.9 | 3.4 | 510 | 2614 | 1832 | 2775 |
| | 2022 | 28.9 | 11.4 | 1.9 | 456 | 2654 | 1852 | 2917 |
| | 10 YR Avg. (2011-20) | 23.4 | 7.6 | 24.0 | 477 | 2669 | 1849 | 2977 |
| Earlton | 2023 | 31.8 | 3.5 | 48.9 | 387 | 2226 | 1491 | 2365 |
| | 2022 | 27.9 | 2.2 | 0.0 | 351 | 2248 | 1514 | 2485 |
| | 10 YR Avg. (2011-20) | 20.6 | 5.4 | 18.0 | 424 | 2176 | 1439 | 2451 |
| Sudbury | 2023 | 30.9 | 6.1 | 4.4 | 515 | 2263 | 1530 | 2429 |
| | 2022 | 27.4 | 7.1 | 1.0 | 319 | 2296 | 1553 | 2582 |
| | 10 YR Avg. (2011-20) | 21.3 | 7.1 | 12.9 | 452 | 2333 | 1574 | 2651 |
| Thunder Bay | 2023 | 31.4 | 3.0 | 29.4 | 300 | 2076 | 1364 | 2241 |
| | 2022 | 26.8 | 0.8 | 20.5 | 477 | 2037 | 1332 | 2227 |
| | 10 YR Avg. (2011-20) | 21.5 | 5.2 | 15.8 | 417 | 2095 | 1346 | 2309 |
| Fort Frances | 2023 | 28.5 | 2.0 | 3.8 | 311 | 2242 | 1523 | 2449 |
| | 2022 | 26.7 | -0.1 | 0.9 | 576 | 2117 | 1413 | 2379 |
| | 10 YR Avg. (2011-20) | 21.3 | 5.4 | 13.6 | 418 | 2220 | 1453 | 2459 |