For forage producers, the production year starts in the fall. What farmers do from mid-August to the end of the growing season impacts this winter’s feed inventory and next year’s forage yield potential.
Feed the crop that feeds the livestock!
Forage crops have the highest crop nutrient removal values of any field crop grown in Ontario. Harvesting the whole crop while it is still green removes far more nutrients from the soil than harvesting grain and straw. Grain crops are fully mature, and as they dry down before harvest, water-soluble nutrients like potassium leach back out into the soil through the roots.
Potassium(K) is important for regulating the water content of plants and is essential in perennial forages as they prepare to overwinter. To get the most value for money, K should be applied about a month before alfalfa starts to harden off for winter. Using the average fall rest period start dates as a guide (Figure 1), this means that potash should be applied mid-July in the north, late July in eastern, central, and western Ontario, and early August in the south.
Since a fertilizer application is being made anyway, this is a good opportunity to also apply any phosphorus (P) and sulphur (S) the crop may need. Remember to factor in nutrients from manure applications when planning top-ups from purchased fertilizer.
Take a break for yield potential’s sake!
Perennial forage crops store energy in their lower stems and roots to fuel early growth the following spring. Alfalfa is especially sensitive to cold stress and issues at green-up if it is not able to create adequate energy reserves in the fall. It takes 450 Growing Degree Days (Base 5˚C) for alfalfa to properly prepare for winter, which is typically about 6 weeks in the fall. This “no cut” time is known as the fall rest period (Figure 1). Once the first killing frost hits – (is minus 4 ˚Celcius (40˚ Fahrenheit) for at least four hours) – alfalfa goes dormant. By not harvesting alfalfa during the fall rest period, growers give it a better chance of overwintering well.
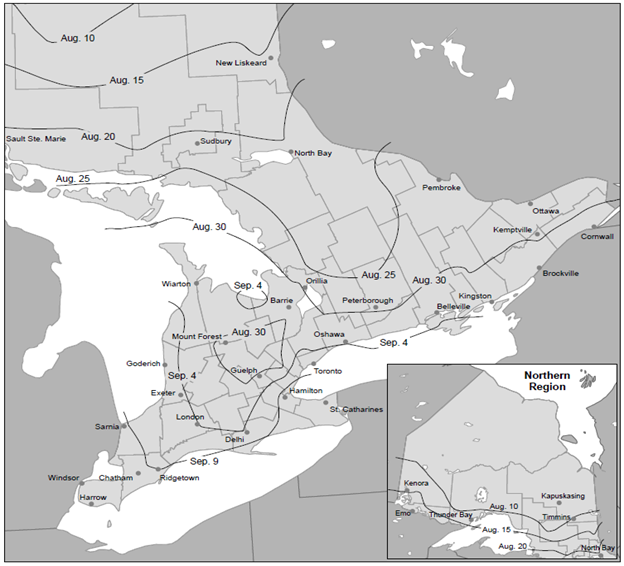
Figure 1. Average start date of the six-week fall rest period for alfalfa.
If winter feed inventory is a concern, growers could take a cut of alfalfa after the killing frost without doing too much damage to the forage crop. Since the alfalfa is dormant, it won’t try to grow back until the spring, which is when it needs the energy stored in its roots. Another option for a fall forage cut are hay fields that are predominantly grass or clover. These crops may smother over winter if they are more than 20 cm (8 inch) tall. They are less sensitive to cold stress than alfalfa and generally do not winterkill because of a fall cutting.
Another way to boost forage inventories is by harvesting annual forages as baleage or silage. These species are often seeded as cover crops, but a good annual forage stand typically requires higher seed rates and some added nutrients. Cereals, peas, and clovers all store well, but growers should avoid harvesting brassicas, turnips, radishes, sunflowers, and other broad-leaved forbs. They are too wet to ferment well and are more prone to spoiling in storage. These complex mixtures are better suited to grazing.
Assess risk and start planning for spring!
Yield potential is an important consideration in a forage production system. The equipment and labour costs per acre barely change between harvesting a low-yielding crop and a high-yielding one. This means that the best way to reduce the cost per tonne of forage is to keep yield potential high.
A fall plant count can provide a baseline to compare to next spring. This is an effective way to assess how much winterkill has occurred. Alfalfa stands thin naturally over time, so only doing spring plant counts doesn’t differentiate between winterkill and thinning during the growing season. See Table 1 for thresholds.
Table 1. Target alfalfa stand plant count.
| Age of stand | Healthy plants |
| New seeding | 53+ plants/0.25m2 (20+ plants/ft2) |
| Year 1 | 32-53 plants/0.25m2 (12-20 plants/ft2) |
| Year 2 | 21-32 plants/0.25m2 (8-12 plants/ft2) |
| Year 3 or older | 13 plants/0.25m2 (5 plants/ft2) |
Guidelines for alfalfa now say to terminate the crop after a lifetime total of 9 to 12 cuts. Cutting is a stressor and taking more than 12 cuts impacts alfalfa’s ability to fend off insect pests and diseases. Planned termination keeps the crop healthy, yield potential high, and cost per tonne low.
Cutting timing and frequency are not the only stressors that affect overwintering success and yield potential in alfalfa. The disease resistance status of the variety, soil fertility levels, and soil drainage also affect winterkill risk. See the score chart on page 121 of OMAFRA Publication 30: Guide to Forage Production to assess your own fields.
Weather Data – August 28 – September 3, 2023
| Location | Year | Highest Temp (°C) | Lowest Temp (°C) | Rain (mm) | Rain (mm) April 1st | GDD 0C April 1st | GDD 5C April 1st | CHU May 1st |
| Harrow | 2023 | 29.0 | 7.8 | 0.0 | 570 | 2612 | 1848 | 2823 |
| 2022 | 30.0 | 14.9 | 9.8 | 387 | 2778 | 2026 | 3127 | |
| 10 YR Norm (11 – 20) | 27.2 | 13.3 | 24.7 | 492 | 2850 | 2042 | 3228 | |
| Ridgetown | 2023 | 29.5 | 5.5 | 4.3 | 500 | 2484 | 1729 | 2635 |
| | 2022 | 30.0 | 11.0 | 8.6 | 277 | 2632 | 1887 | 2893 |
| | 10 YR Avg. (2011-20) | 26.9 | 11.6 | 20.4 | 444 | 2685 | 1882 | 3007 |
| London | 2023 | 28.1 | 7.3 | 3.7 | 543 | 2463 | 1708 | 2620 |
| | 2022 | 29.7 | 10.4 | 10.6 | 318 | 2562 | 1827 | 2823 |
| | 10 YR Avg. (2011-20) | 26.4 | 11.4 | 23.2 | 462 | 2659 | 1861 | 2984 |
| Brantford | 2023 | 28.3 | 6.3 | 3.9 | 441 | 2444 | 1688 | 2592 |
| | 2022 | 30.7 | 9.2 | 10.9 | 287 | 2577 | 1831 | 2769 |
| Welland | 2023 | 26.5 | 8.3 | 2.7 | 489 | 2493 | 1731 | 2666 |
| | 2022 | 29.3 | 10.4 | 22.2 | 316 | 2630 | 1874 | 2909 |
| | 10 YR Avg. (2011-20) | 26.4 | 12.1 | 19.8 | 409 | 2679 | 1879 | 3013 |
| Elora | 2023 | 27.5 | 5.6 | 7.4 | 436 | 2263 | 1524 | 2382 |
| | 2022 | 29.7 | 8.7 | 10.3 | 254 | 2363 | 1630 | 2543 |
| | 10 YR Avg. (2011-20) | 25.3 | 9.3 | 25.2 | 459 | 2405 | 1620 | 2671 |
| Mount Forest | 2023 | 26.8 | 5.2 | 9.0 | 392 | 2261 | 1527 | 2391 |
| | 2022 | 28.2 | 7.1 | 38.0 | 374 | 2353 | 1626 | 2578 |
| | 10 YR Avg. (2011-20) | 24.5 | 9.5 | 32.3 | 478 | 2392 | 1615 | 2689 |
| Peterborough | 2023 | 28.9 | 4.5 | 0.4 | 410 | 2317 | 1566 | 2402 |
| | 2022 | 29.9 | 8.7 | 7.0 | 323 | 2370 | 1623 | 2554 |
| | 10 YR Avg. (2011-20) | 25.4 | 7.0 | 19.8 | 409 | 2438 | 1652 | 2670 |
| Kemptville | 2023 | 28.7 | 7.2 | 25.4 | 506 | 2463 | 1717 | 2595 |
| | 2022 | 31.6 | 8.2 | 25.6 | 454 | 2525 | 1758 | 2762 |
| | 10 YR Avg. (2011-20) | 24.9 | 9.4 | 17.1 | 453 | 2563 | 1778 | 2854 |
| Earlton | 2023 | 29.1 | 4.2 | 26.7 | 338 | 2109 | 1409 | 2241 |
| | 2022 | 28.8 | 4.6 | 24.5 | 351 | 2133 | 1434 | 2353 |
| | 10 YR Avg. (2011-20) | 21.9 | 6.4 | 20.0 | 406 | 2089 | 1388 | 2361 |
| Sudbury | 2023 | 26.3 | 5.3 | 33.3 | 511 | 2140 | 1442 | 2291 |
| | 2022 | 27.6 | 3.9 | 14.5 | 318 | 2169 | 1462 | 2433 |
| | 10 YR Avg. (2011-20) | 23.5 | 7.3 | 16.2 | 439 | 2238 | 1514 | 2547 |
| Thunder Bay | 2023 | 32.8 | 1.9 | 5.1 | 271 | 1972 | 1294 | 2128 |
| | 2022 | 29.4 | 1.9 | 3.6 | 457 | 1936 | 1266 | 2114 |
| | 10 YR Avg. (2011-20) | 22.9 | 4.8 | 18.1 | 402 | 2006 | 1292 | 2215 |
| Fort Frances | 2023 | 32.1 | 4.5 | 0.5 | 308 | 2142 | 1458 | 2338 |
| | 2022 | 30.2 | 2.3 | 3.6 | 575 | 2016 | 1347 | 2263 |
| | 10 YR Avg. (2011-20) | 23.0 | 5.4 | 16.0 | 405 | 2131 | 1399 | 2364 |
3 thoughts on “Crop Report – Week of September 4th, 2023”
Comments are closed.