Planting corn directly into a living cover crop before it is killed by herbicide or tillage is not something that would have been considered 30 years ago. However, with advances in planter technology, herbicide options, and a greater awareness of cover crop benefits to soil health, more growers are doing it. According to the 2022-2023 US National Cover Crop Survey, the practice of “planting green” has grown in popularity, with a 22% increase compared to 2016-2017. Over 38% of respondents in 2022-2023 who grew a cover crop before corn reported terminating it at or shortly after seeding. In Ontario, while planting green for corn is not mainstream, it has also increased in popularity.
Most research trials have focused on the impact of termination timing of a cereal rye cover crop ahead of corn planting. In Ontario, corn is often planted following winter wheat, after which several different overwintering species, such as crimson clover, hairy vetch, and brassicas, can be seeded. The impact of planting corn green into such mixtures is not well known.
For those looking over the fence at these systems, the key question is: does it work? To help provide an answer, I followed five Ontario corn fields during the 2023 season that were planted green into cover crop mixtures. The objective was to identify common challenges, highlight differences across soil types, and define key elements to success.
Average corn yield across the five fields was 193.7 bu/ac, which surpassed county average values by nearly 30 bu/ac. The main learnings were:
- Target modest spring cover crop growth to reduce planting challenges.
- Modify planter with appropriate downforce and closing wheels.
- Apply a higher-than-standard upfront nitrogen rate.
- And match burndown herbicides to control all cover crop species and avoid escapes.
Read on to learn more. For the video interview summary, click here.
Five different fields
The five fields were spread across four different counties: Brant, Bruce, Haldimand, and Niagara (Table 1). Soil textures ranged from sandy loam to silty clay. Experience level of cooperating farmers planting corn green into cover crops spanned 0 to 8 years.
Table 1. Soil series and years’ experience planting green.
| Field | Soil series | Prior years’ experience planting green (corn) |
| Field 1 – Bruce | Berrien sandy loam | 8 |
| Field 2 – Brant | Gobles loam/Colwood silt loam/ Waterloo sandy loam | 0 |
| Field 3 – Brant | Woolwich and Dumfries silt loam/ Guelph loam | 7 |
| Field 4 – Haldimand | Haldimand silty clay/Lincoln silty clay | 2 |
| Field 5 – Niagara | Chinguacousy clay loam/ Jeddo clay loam | 7 |
Stand counts were performed across 6-12 locations in each field and averaged. Uniformity of emergence was evaluated, and crop stage and height were measured and recorded monthly. Yield was self-reported by cooperating farmers and represents dry (15.5% moisture) bushels per acre, weighed, unless otherwise noted.
Cover crop mixtures
All sites had a cover crop mixture seeded the preceding summer, following the harvest of a small grain. Number of species ranged from five (Field 4 – Haldimand) to 14 (Field 2 – Brant). The species that overwintered at each site are listed below (Table 2).
Table 2. Background cover crop information.
| Site | Total # of species in mix | Seeding rate (lbs/ac) | Seeding date (2022) | Overwintering cover crop species | Manure application to cover crop |
| Field 1 – Bruce | 11 | 25 | Aug. 9 | Kale Hairy vetch Cereal rye | 6 tons/ac, dairy (compost pack) |
| Field 2 – Brant | 14 | 40 | July 20 | Hairy vetch Cereal rye Vivant hybrid brassica Turnip Crimson clover Austrian winter pea | 2-3 tons/ac, poultry (broiler) |
| Field 3 – Brant | 7 | 46 | Aug. 9 | Hairy vetch Turnip Crimson clover Austrian winter pea Tillage radish* | 5 tons/ac poultry (layer) |
| Field 4 – Haldimand | 5 | 40 | Aug. 18 | Hairy vetch Cereal rye | Unknown rate, solid cattle |
| Field 5 – Niagara | 12 | 25 | Aug. 2 | Hairy vetch Crimson clover Turnip | None |
*tillage radish survival over winter was sparse and represented a small percentage of seeded plants
Cover crop biomass
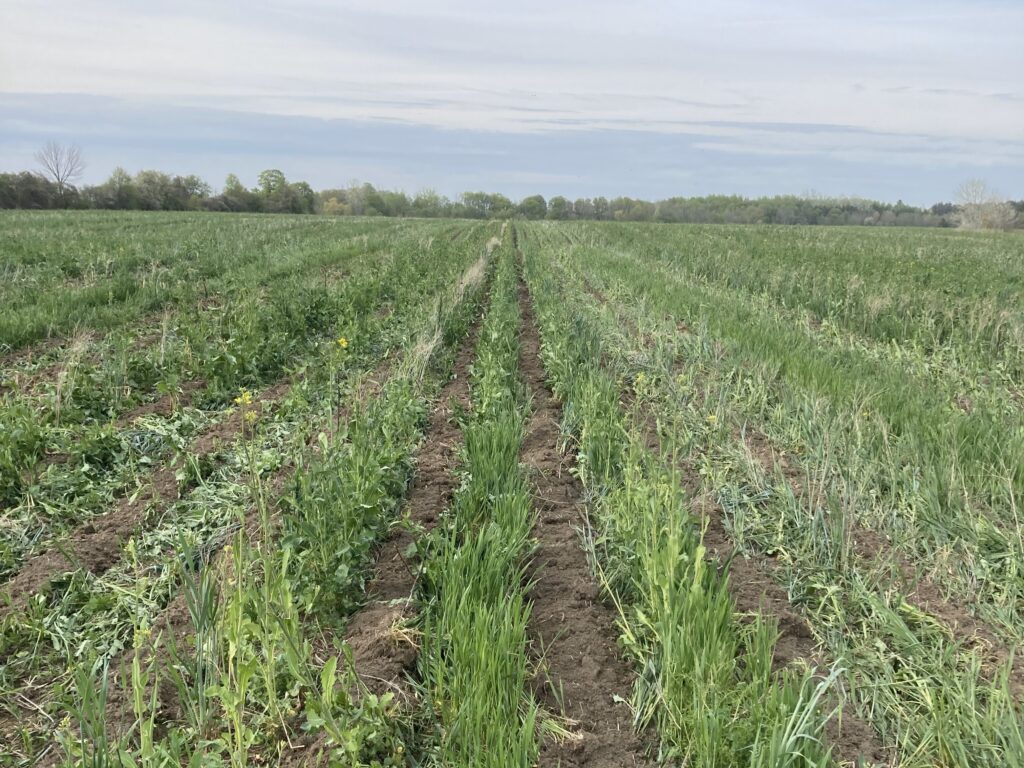
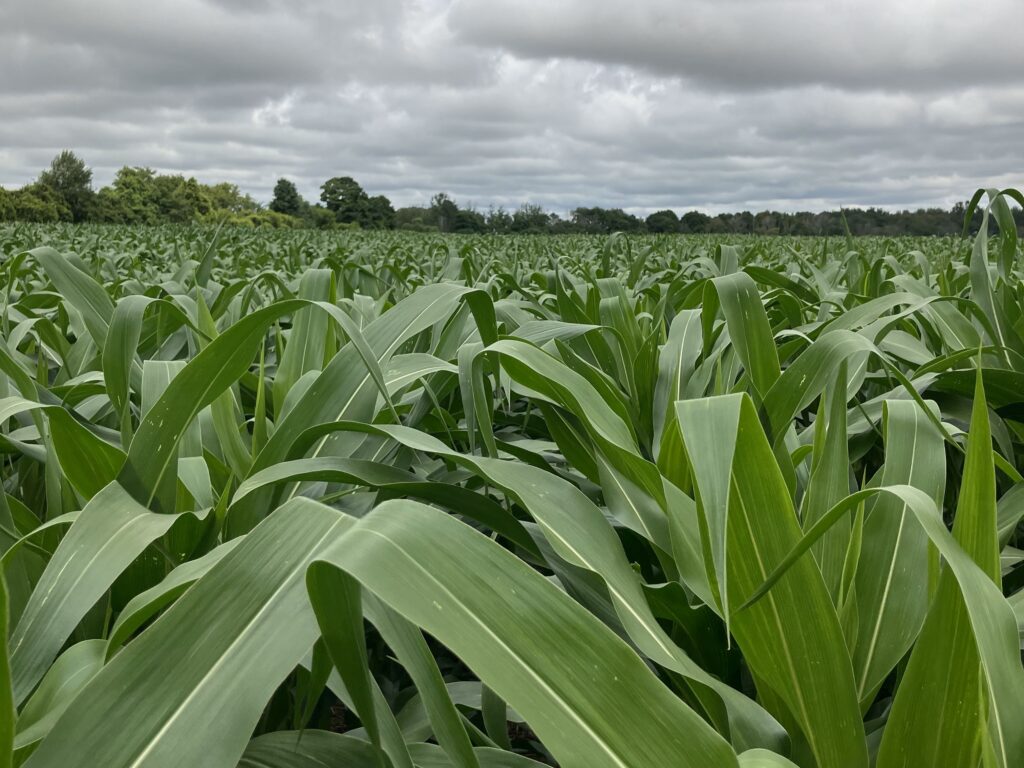
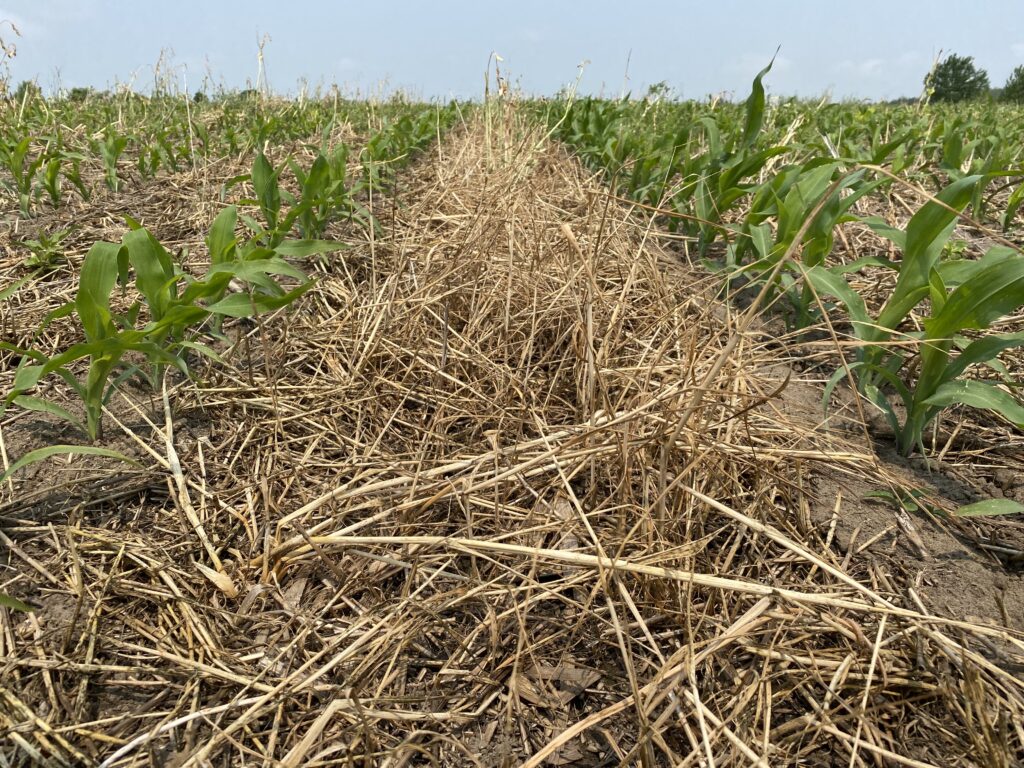
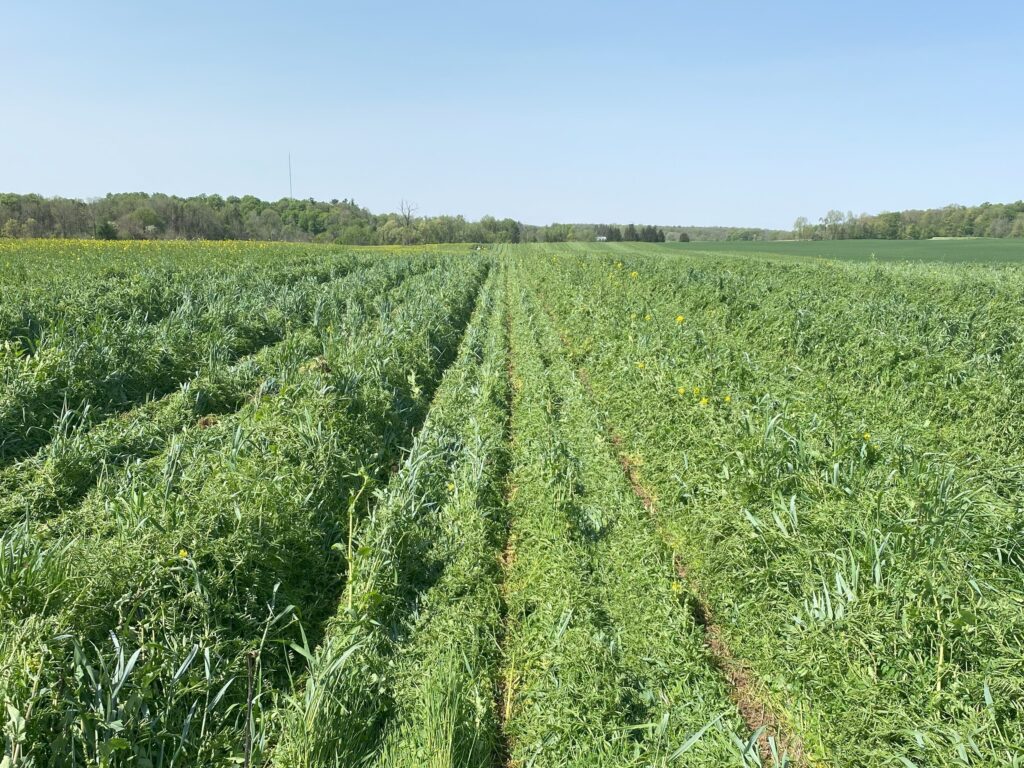
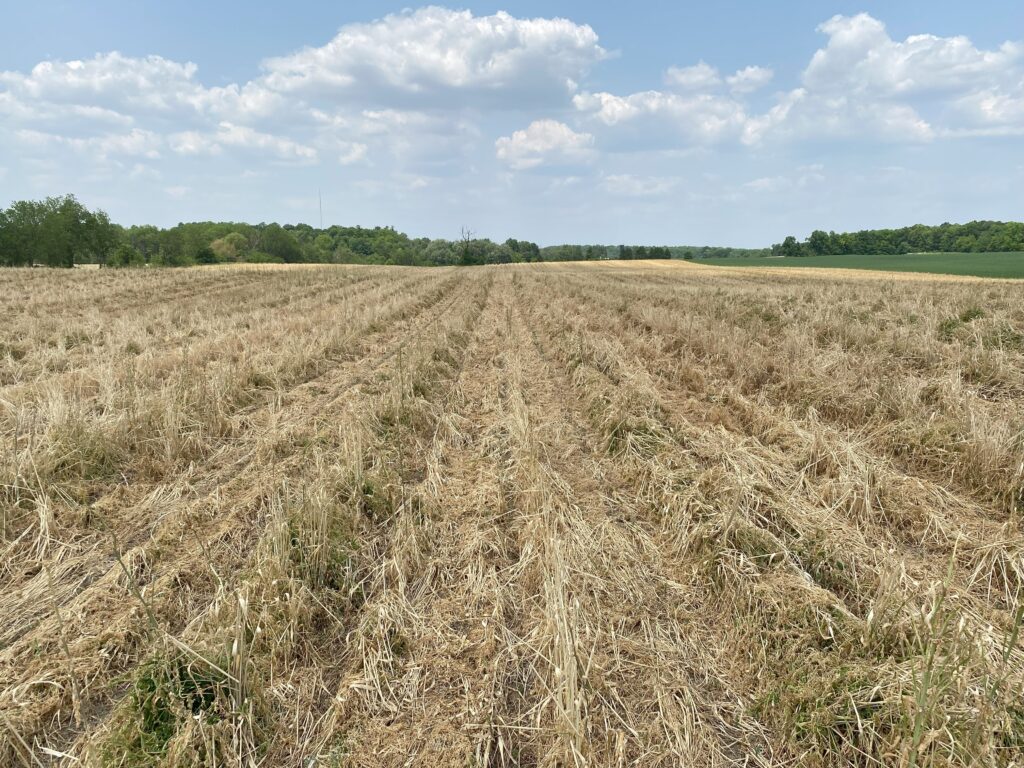
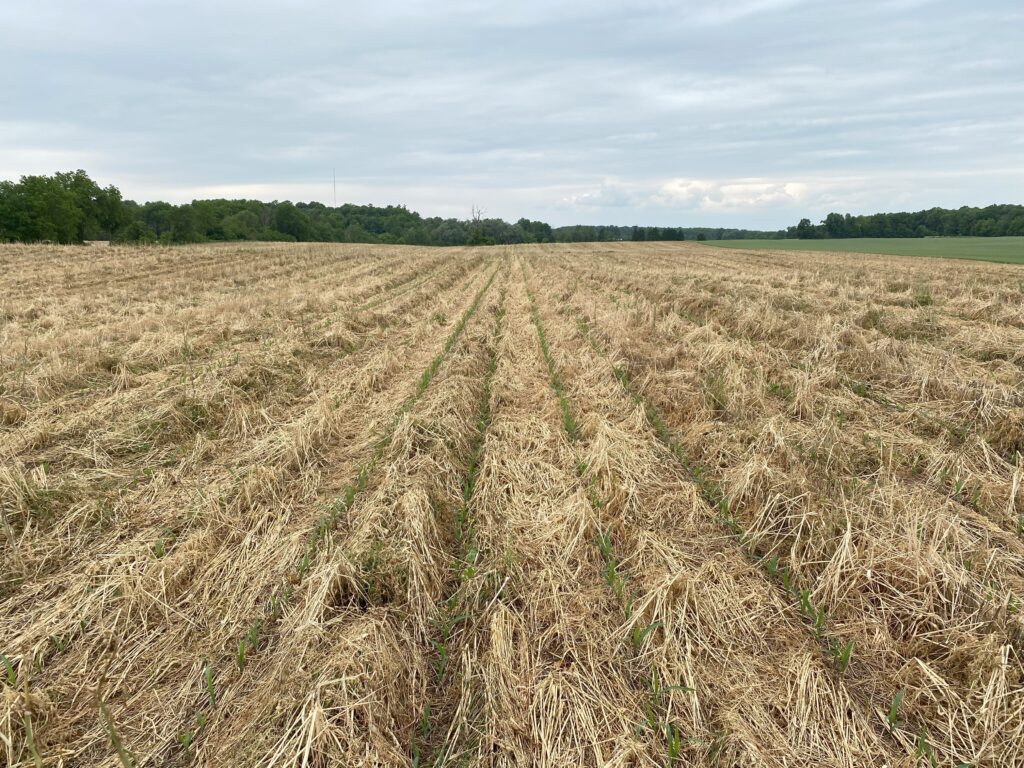
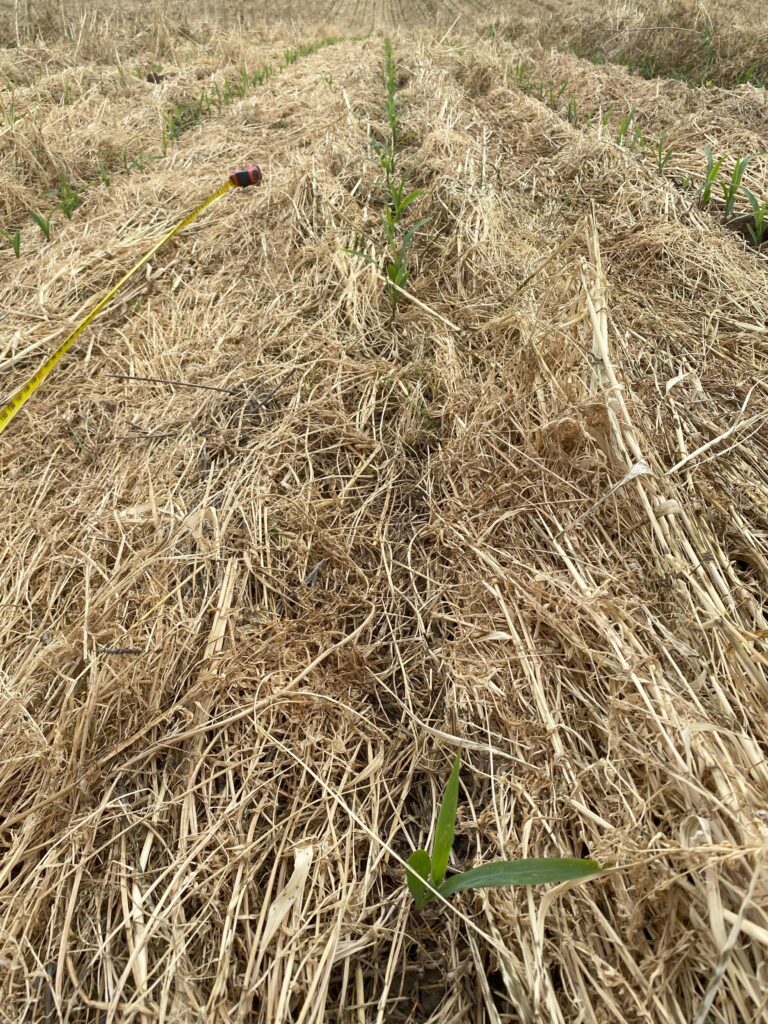
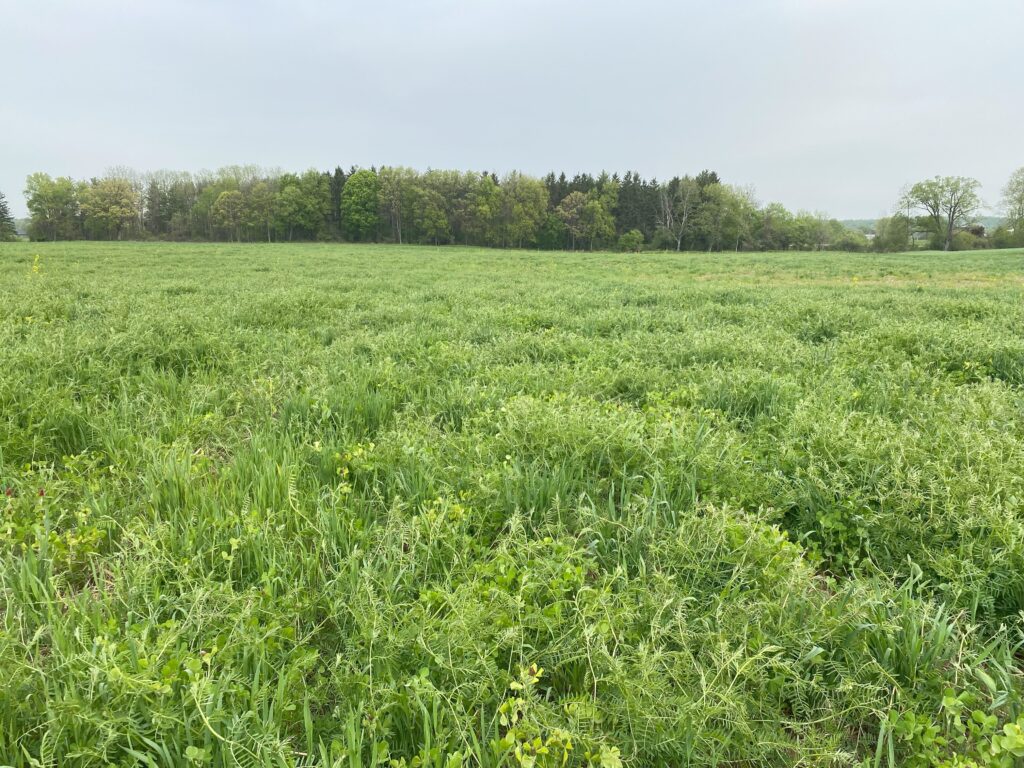
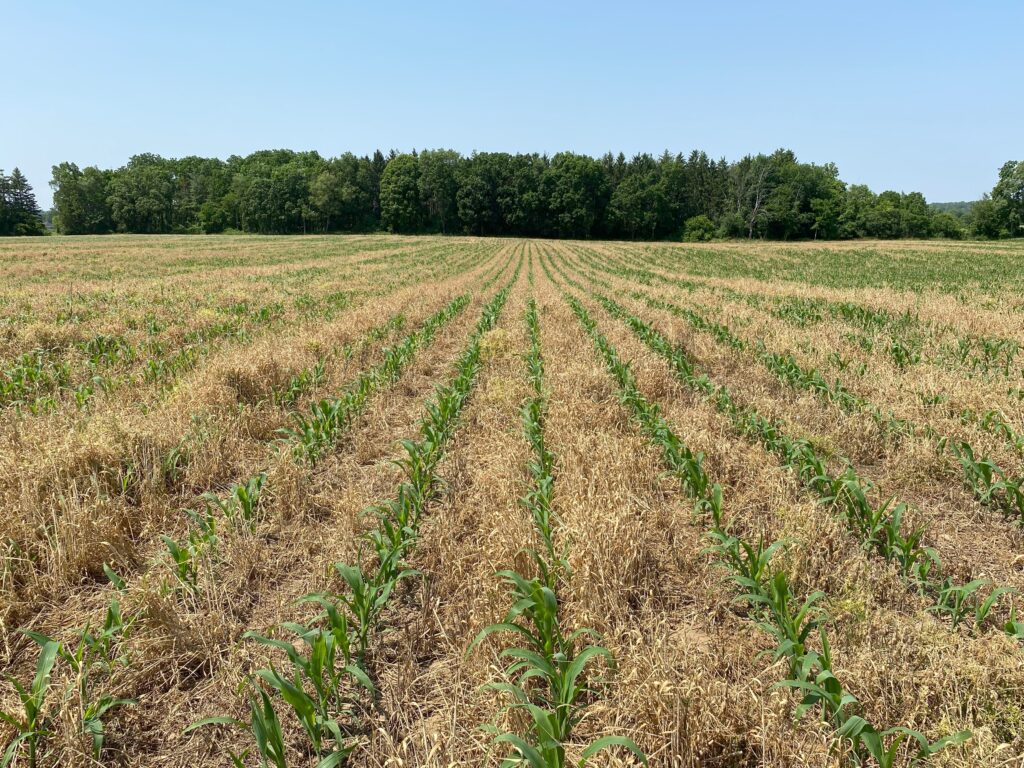
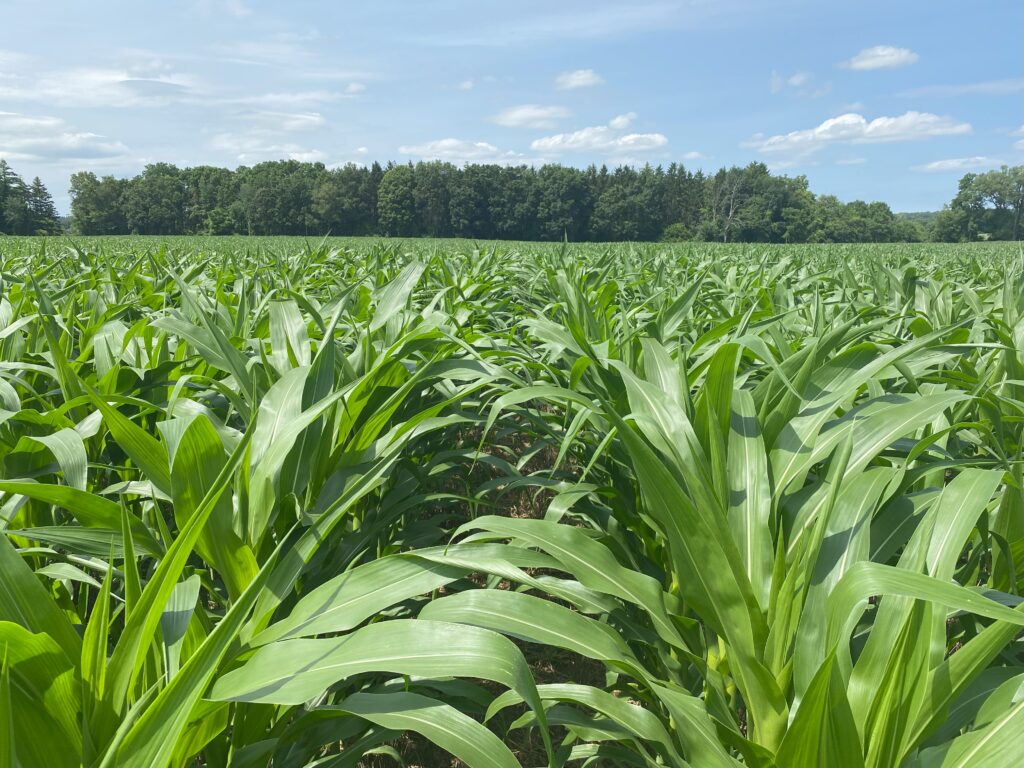
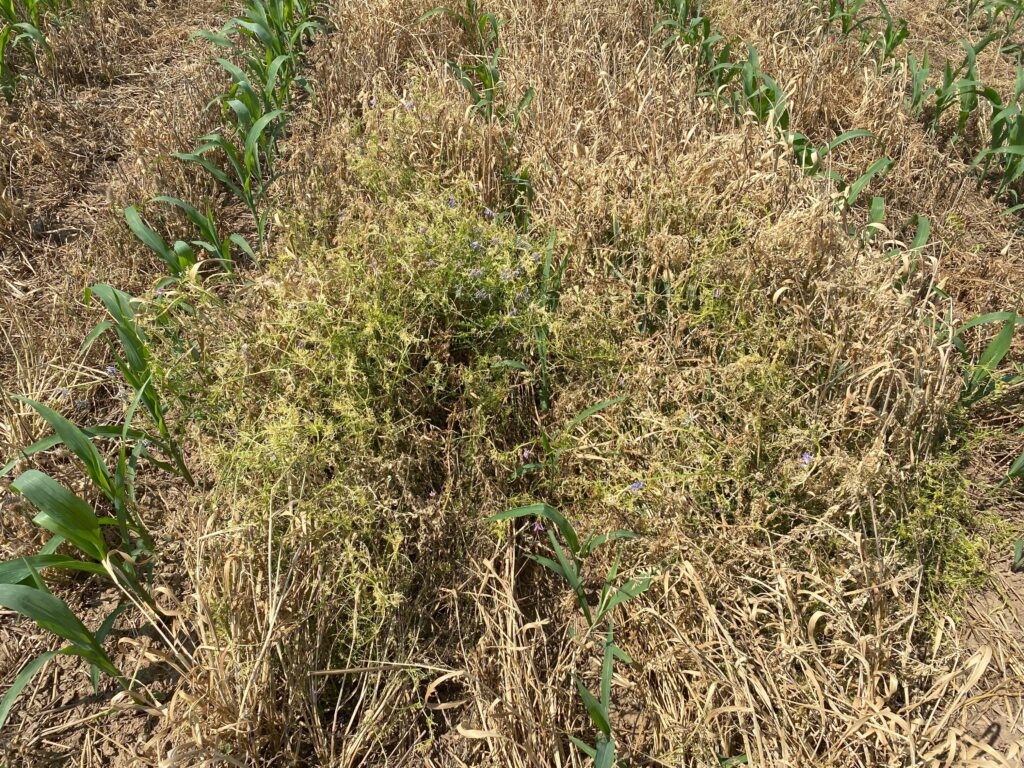
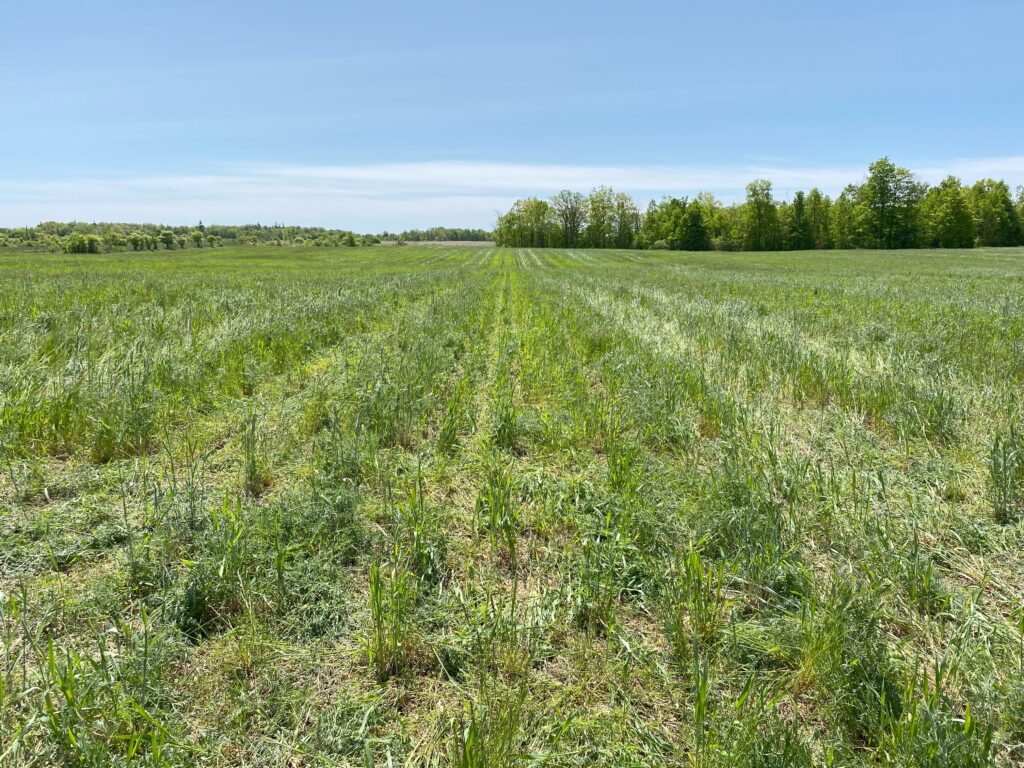
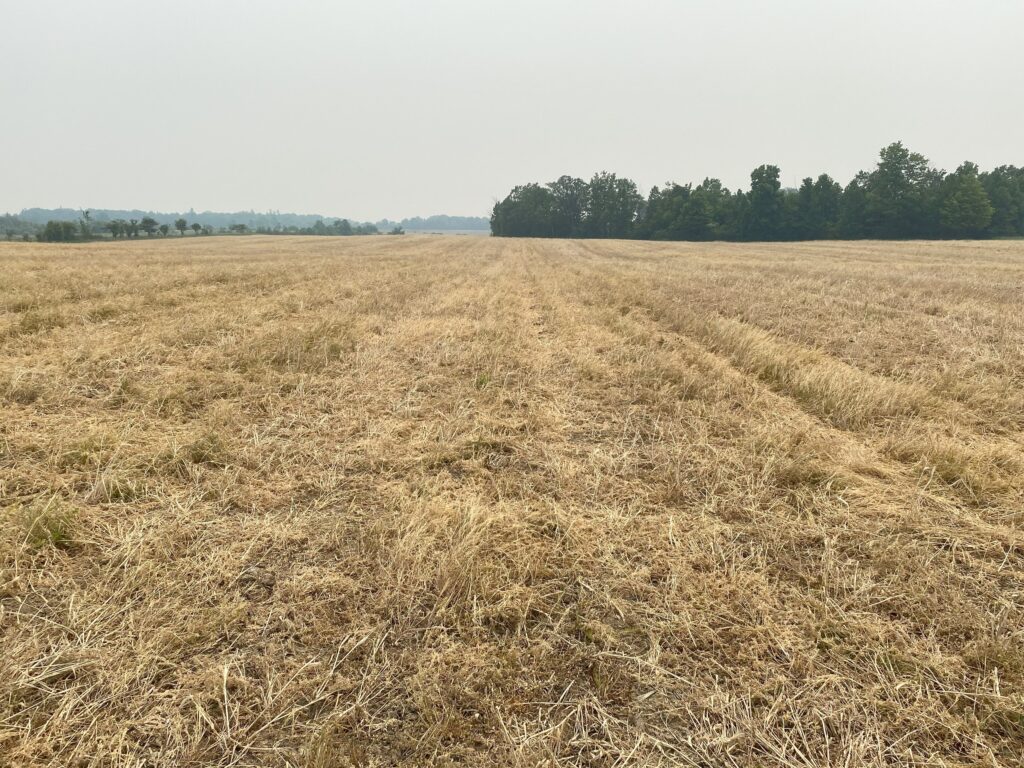
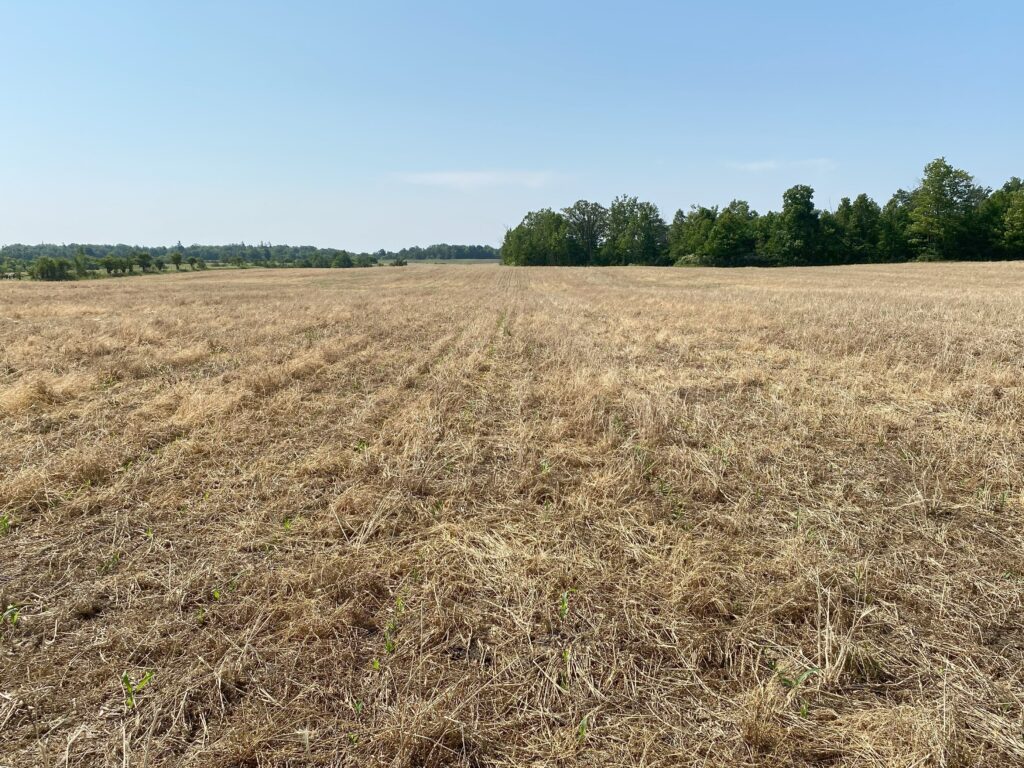
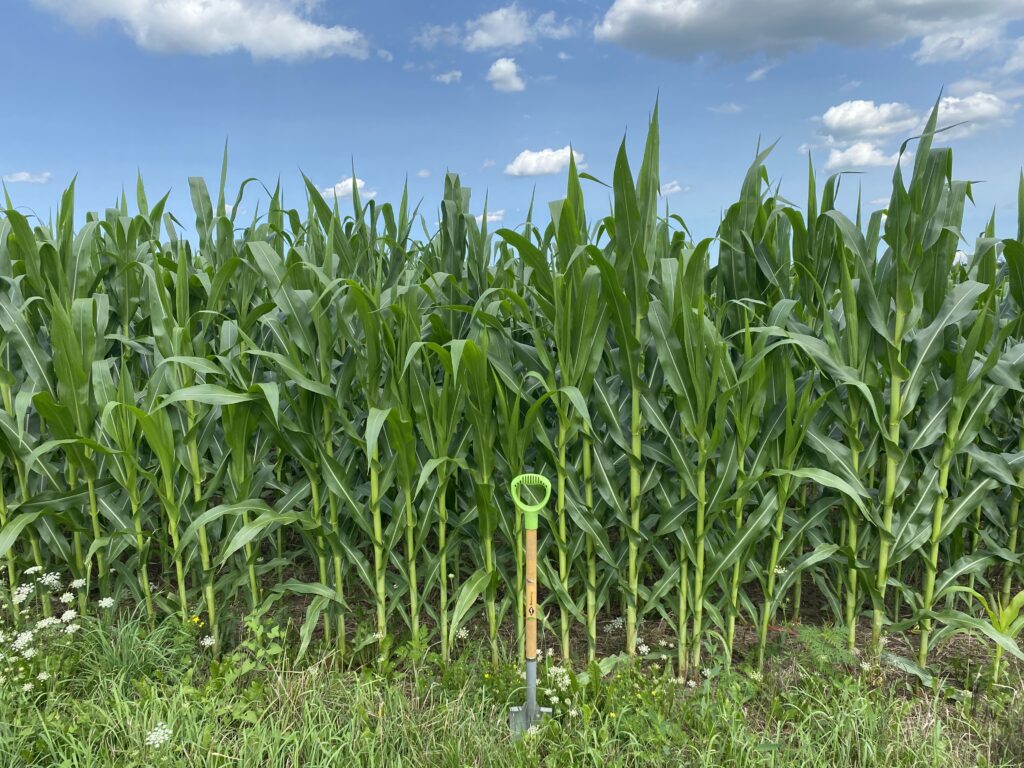
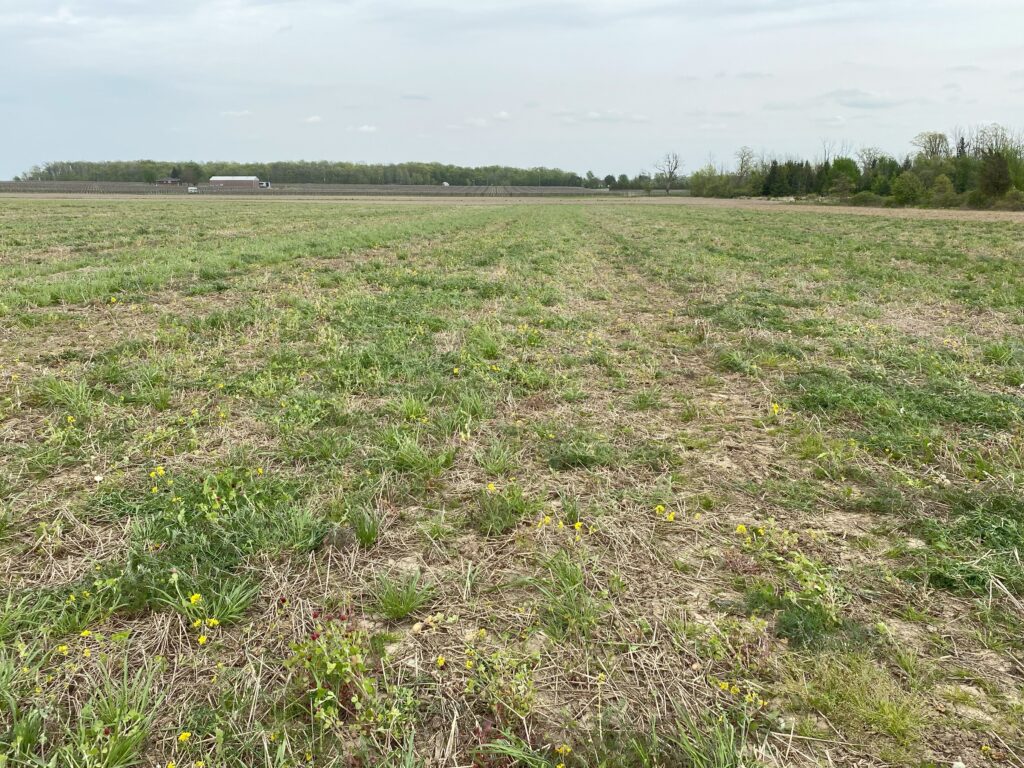
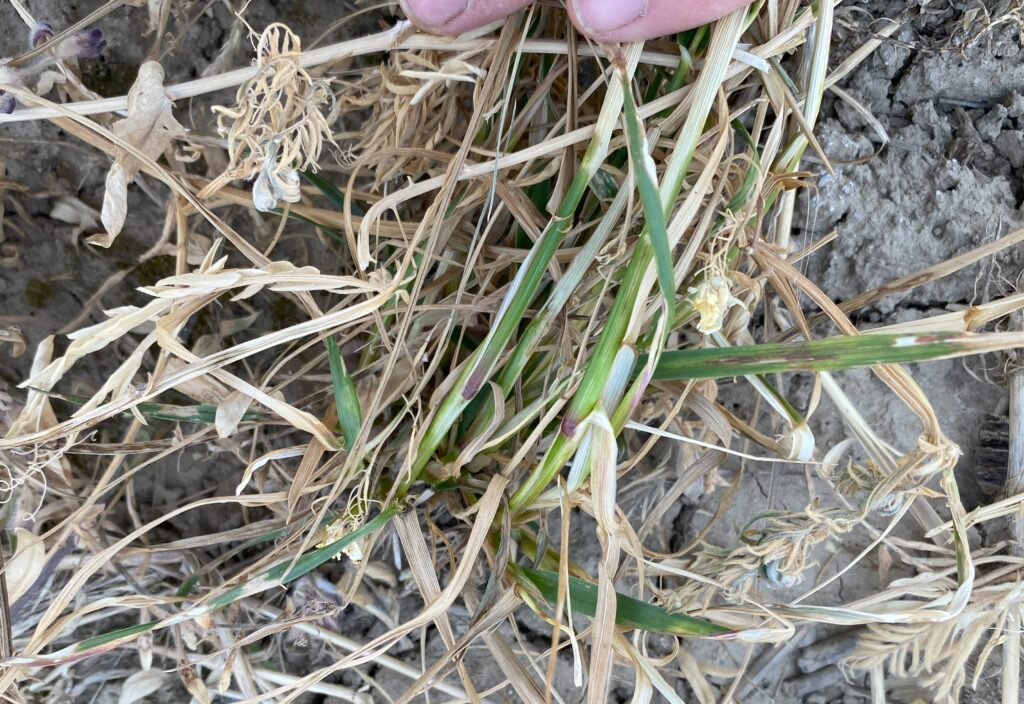
All sites except Field 1 had cover crop biomass sampled, dried, and weighed at the time of termination in spring. Figure 1 shows the range in biomass across the four sites. Field 2 – the site with the earliest seeding date (July 20), second highest seeding rate (40 lbs/ac), and most overwintering species – had the thickest stand, with over 4,500 lbs/ac dry matter (Figure 2). Field 5 had the lightest stand, with only 730 lbs/ac of plant material.
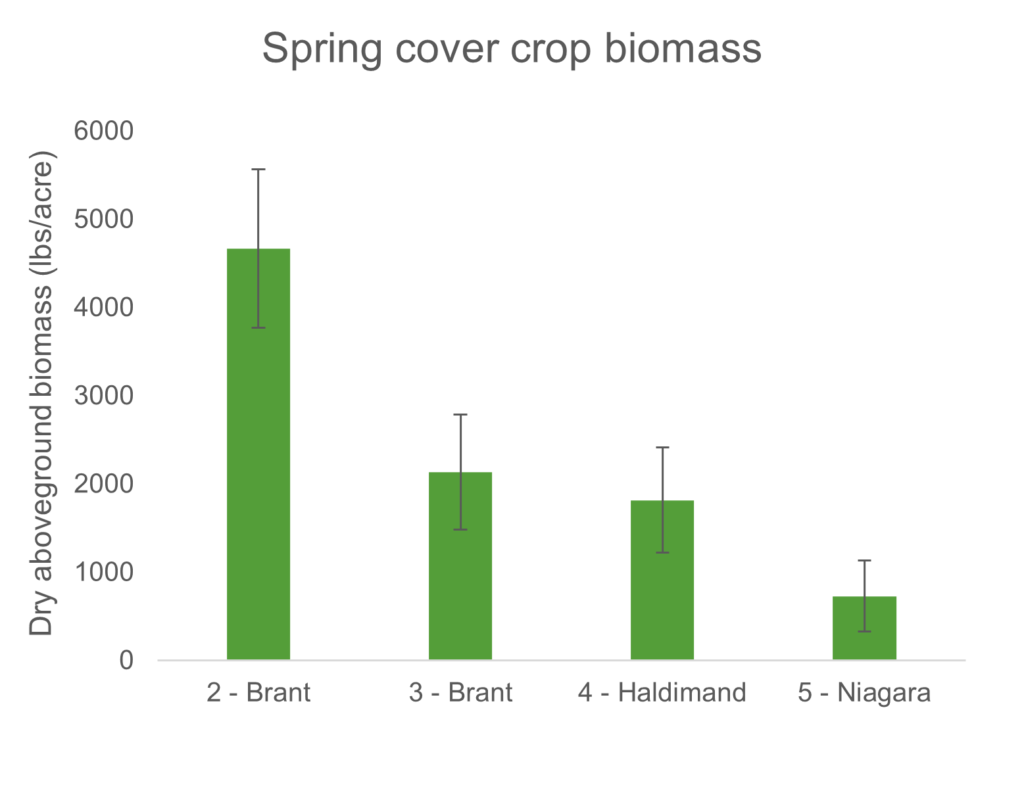
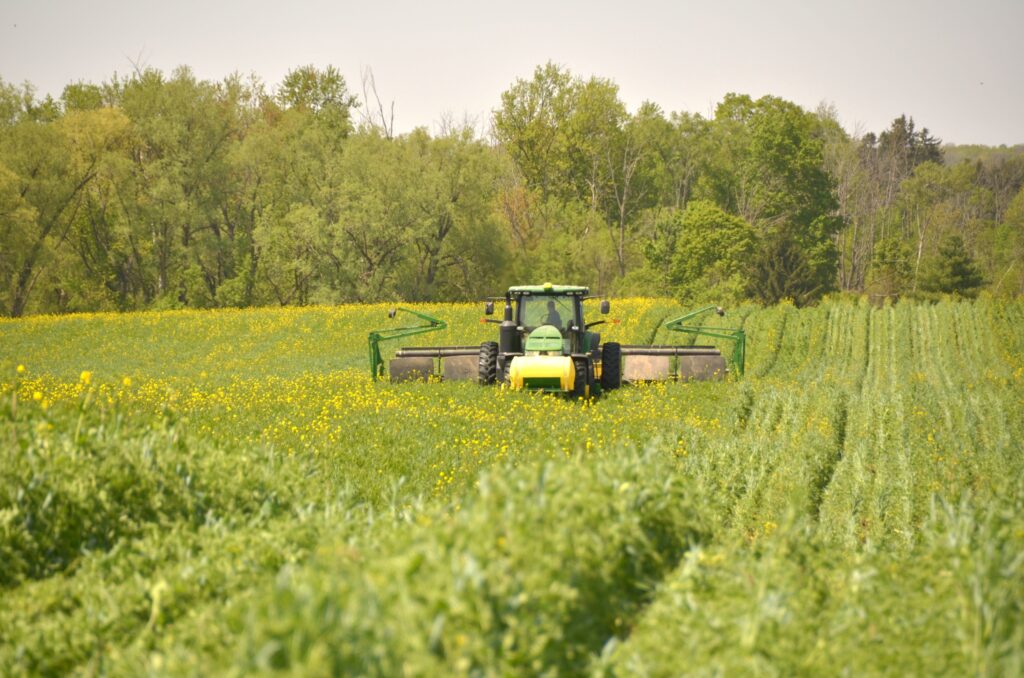
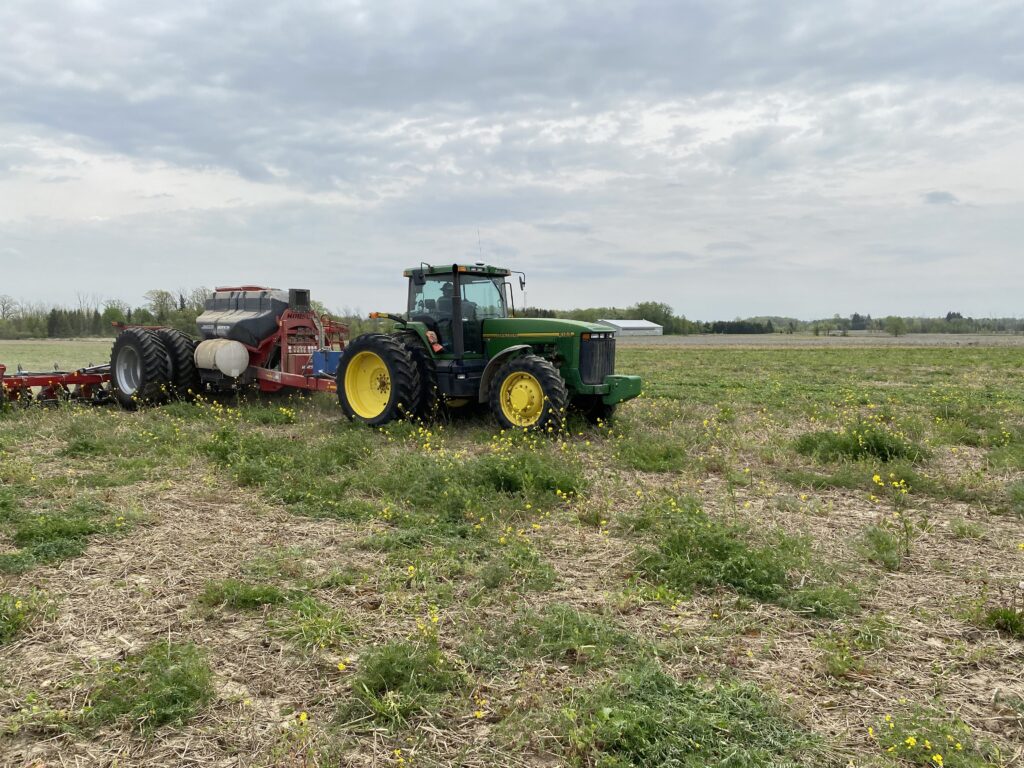
Figure 2. Extremes in cover crop growth across sites.
Cover crop mixture composition
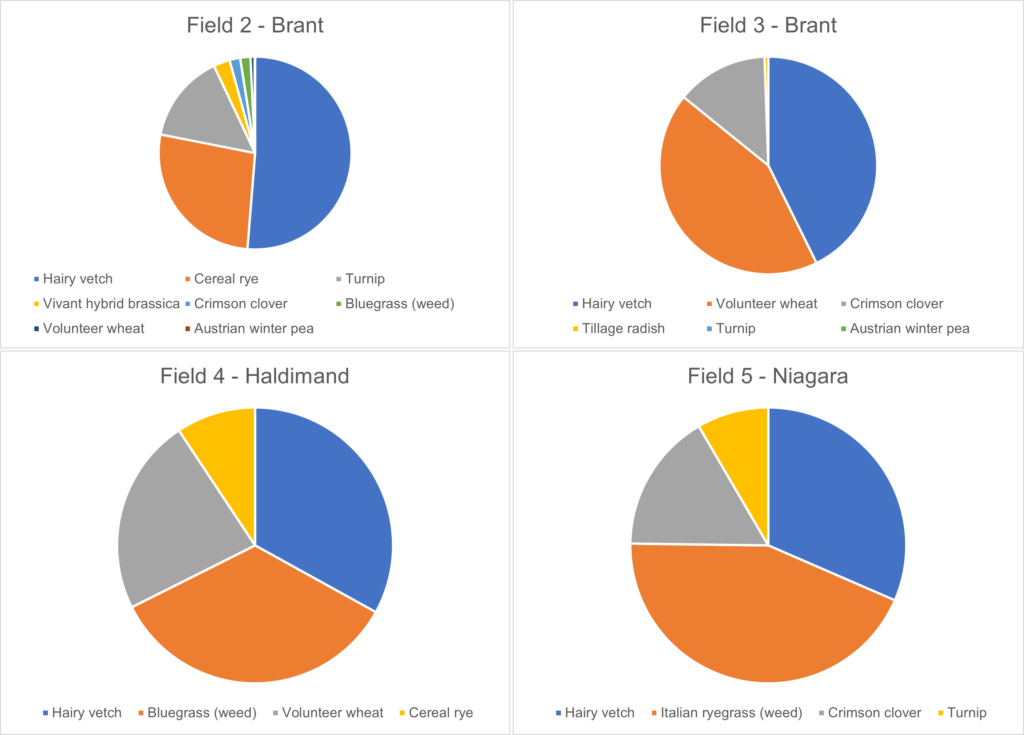
The most dominant seeded species at the time of corn planting was hairy vetch at all four sites (Figure 3). Where included in mixes, overwintering brassicas made a modest contribution to total biomass, as did crimson clover. Austrian winter pea made up a negligible percentage of biomass where it was a part of mixes (Fields 2 and 3). Interestingly, a small amount of tillage radish overwintered at Field 3.
Seeded cover crop species weren’t the only ones present in spring. Volunteer wheat contributed a significant proportion of biomass at Fields 3 and 4. Also, in two instances a weed species made up the greatest percentage of cover crop biomass – bluegrass in Field 4 and Italian ryegrass in Field 5.
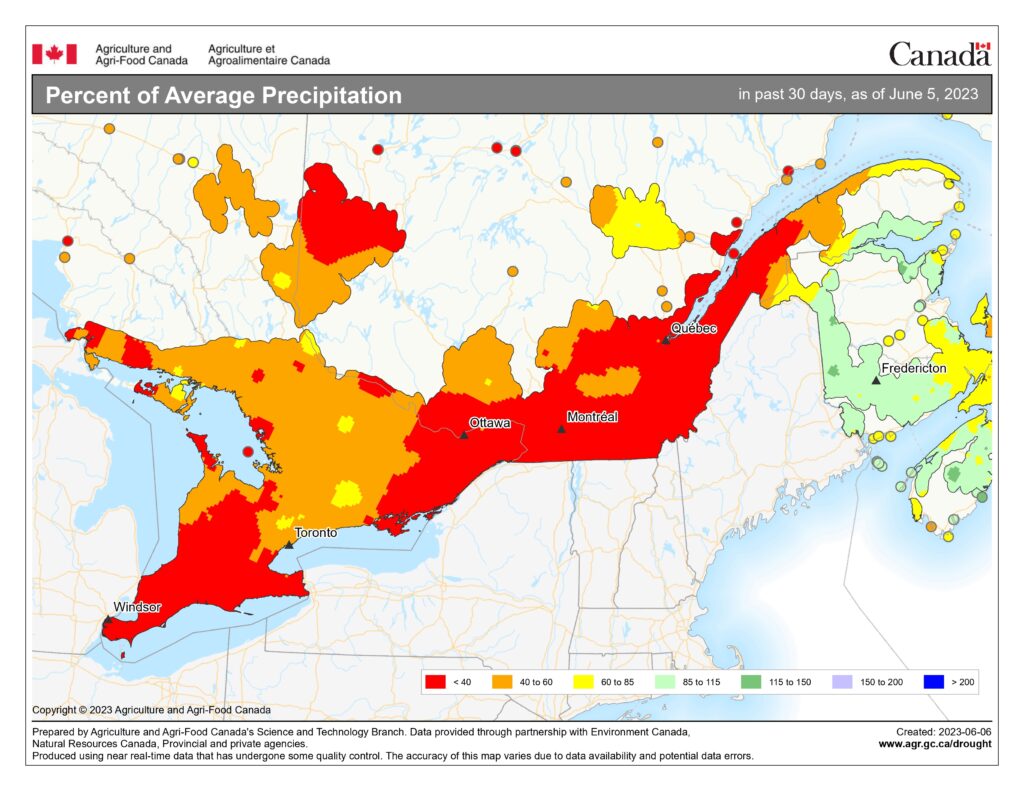
2023: A dry, hot start followed by ample rainfall
Corn planting in southwestern Ontario began the week of May 7th, with most of the crop seeded the week of May 14th. Hot, sunny, and dry conditions occurred throughout the second half of May. All southern Ontario experienced rainfall well below normal in May (Figure 4), with no rainfall at all after May 20th for approximately three weeks. A desperately needed rain fell across much of the study region on June 11th. It provided 0.5-1 inch of precipitation. The months of June, July, and August then saw frequent rain and thunderstorms – precipitation was 15-85% higher than normal in the study area across these months.
As you read on, you will see how these weather conditions impacted the “plant green” corn crop at each site.
Field 1 – Bruce
- Corn yield: 194.3 bu/ac
- Cover crop strip-tilled and sprayed with Roundup and Converge XT on May 12th
- Planted P9608AM and P9624Q hybrids on May 13th at rate of 34,000 seeds/acre with a John Deere 1770 planter with:
- Unit-mounted coulter
- Heavy duty down-pressure springs
- One smooth and one Dawn Curvetine closing wheel
- 140 lbs/ac commercial nitrogen applied (+ manure N contribution)
- 140 lbs/ac nitrogen applied at planting:
- 30 lbs-N/acre as 2×2 band
- 110 lbs-N/ac applied as carrier for herbicide
- 140 lbs/ac nitrogen applied at planting:
- Cover crop rolled with smooth roller
Final stand: 33,200 plants/acre
Field notes:
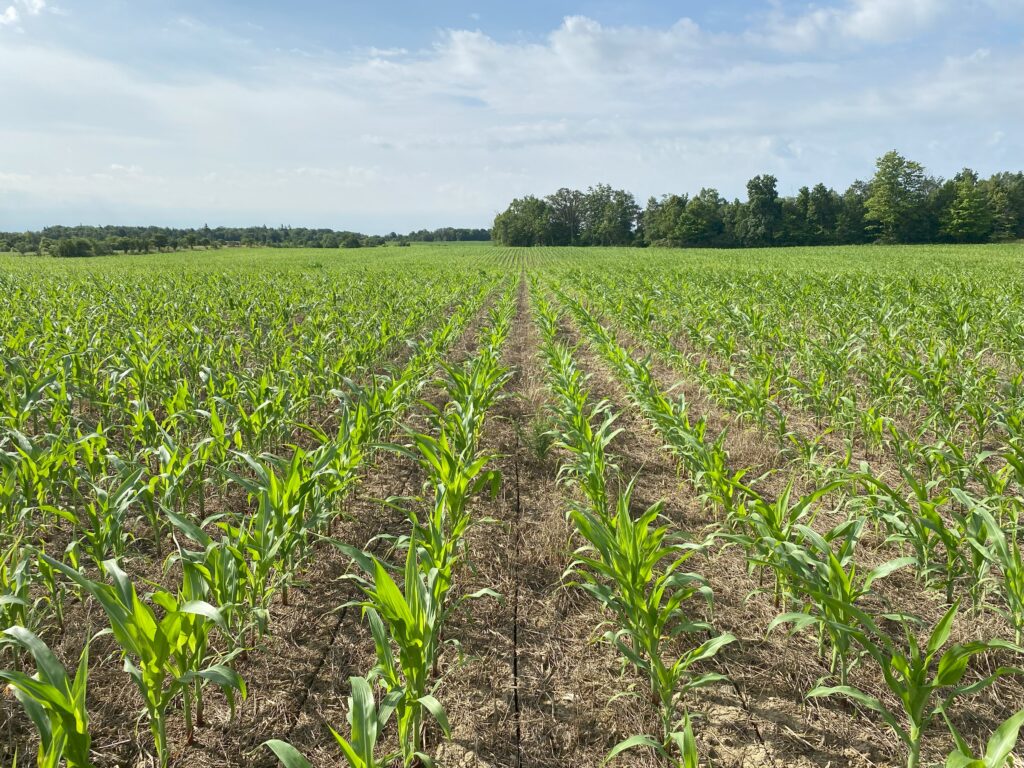
- Strongest corn stand and most uniform crop development across all five sites
- Modest mat of residue in between strip-tilled zones – reduced evaporation on sandy soil
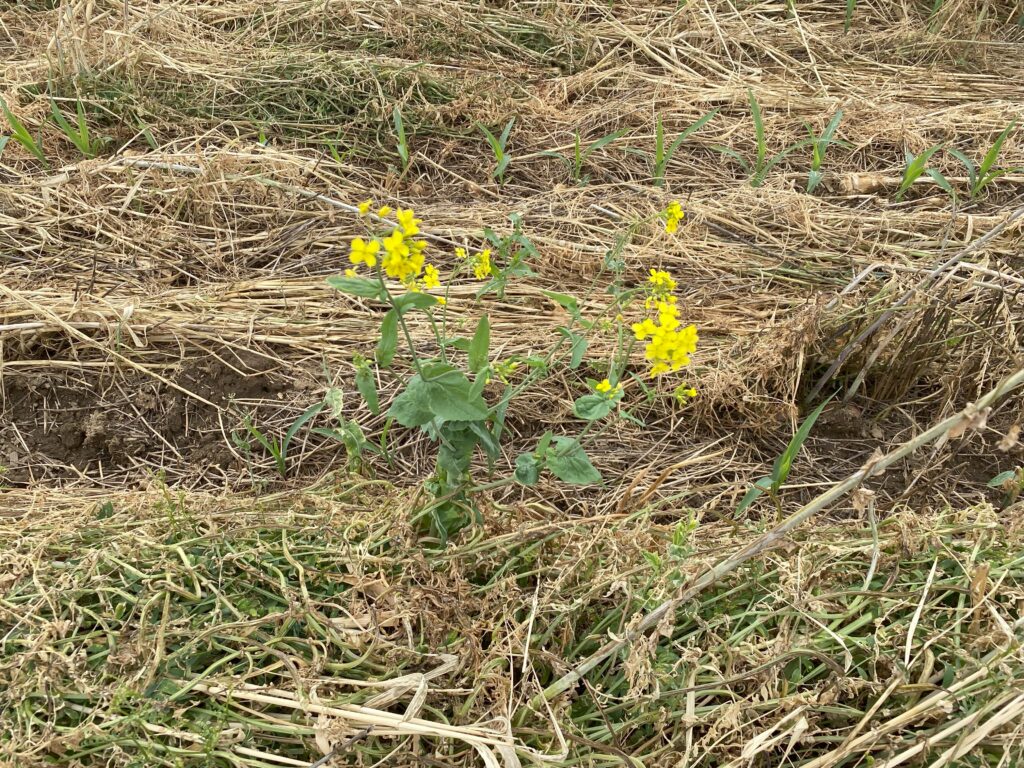
- Burndown did not completely kill all cover crop species, in particular hairy vetch and kale
Field 2 – Brant
- Corn yield: 209.4 bu/ac
- Planted DKC48-56RIB on May 15th at a rate of 33,600 seeds/acre with a John Deere 1770 planter:
- Dawn screw-adjust row cleaners
- Pneumatic downforce (set pressure)
- Yetter Twister closing wheels
- Sprayed cover crop with Roundup, Dual and Marksman on May 16th
- 132 lbs/ac commercial nitrogen applied (+ manure N contribution)
- 132 lbs/ac nitrogen applied at planting:
- 12 lbs-N/ac applied in 2×2 band
- 120 lbs-N/ac applied as carrier for herbicide (with urease inhibitor)
- 132 lbs/ac nitrogen applied at planting:
Final stand: 29,600 plants/acre
Field notes:
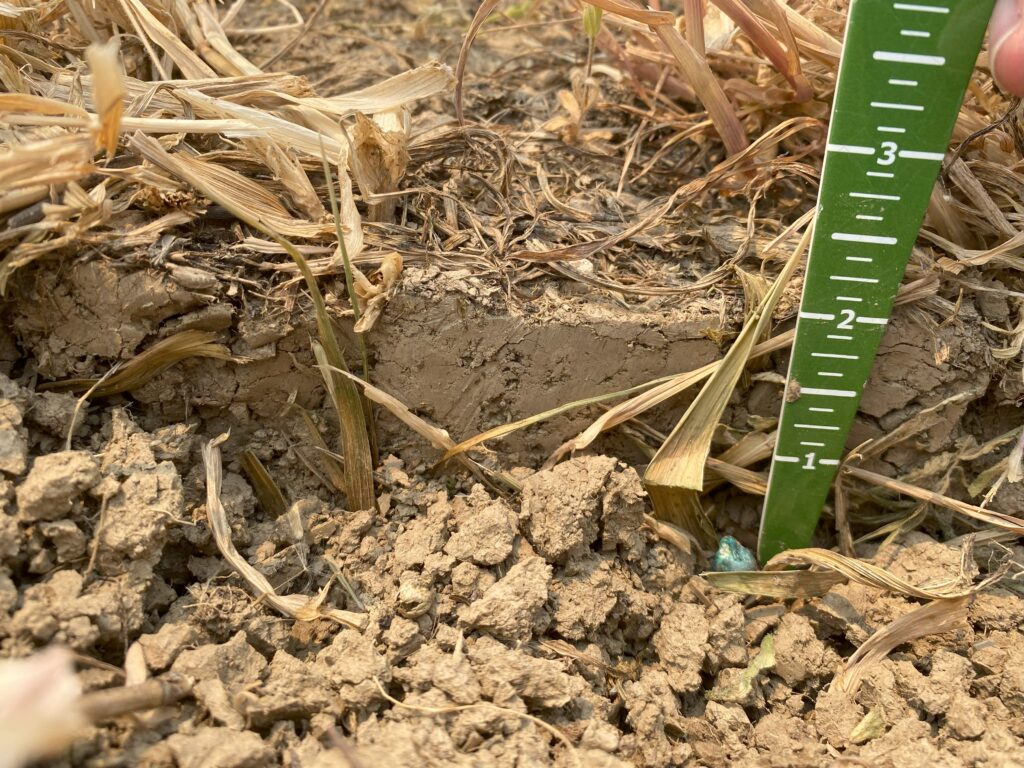
- Planted into good soil moisture conditions at depth of ~2.5 inches using airbags set at 300-350 psi
- Slowest corn development across all sites due to thick cover crop mulch
- Some large gaps in stand – due mostly to corkscrewed corn and partly to blown-out chunks of soil in row
- Cover crop escapes from burndown where plant material was laid down by planter
Field 3 – Brant
- Corn yield: 216 bu/ac*
- Planted DK48-08 on May 19th at a rate of 33,100 seeds/acre with a Kinze 3605 planter:
- RevealTM row cleaners
- DeltaForce – automated row-by-row hydraulic downforce
- Yetter Poly Spike closing wheels
- Sprayed cover crop with Roundup, Eragon and Converge on May 23rd
- 134 lbs/ac commercial nitrogen applied (+ manure N contribution)
- 74 lbs/ac nitrogen applied at planting:
- 10 lbs-N/ac applied as 2×2 band
- 64 lbs-N/ac applied as carrier for herbicide (with urease and nitrification inhibitor)
- 60 lbs/ac nitrogen applied as Y-drop in crop
- 74 lbs/ac nitrogen applied at planting:
*No yield data available for field. Reported value is Agricorp farm average for corn for cooperating farmer in 2023. Yields ranged from 204-236 bu/ac across farmer’s fields (all managed similarly).
Final stand: 30,500 plants/acre
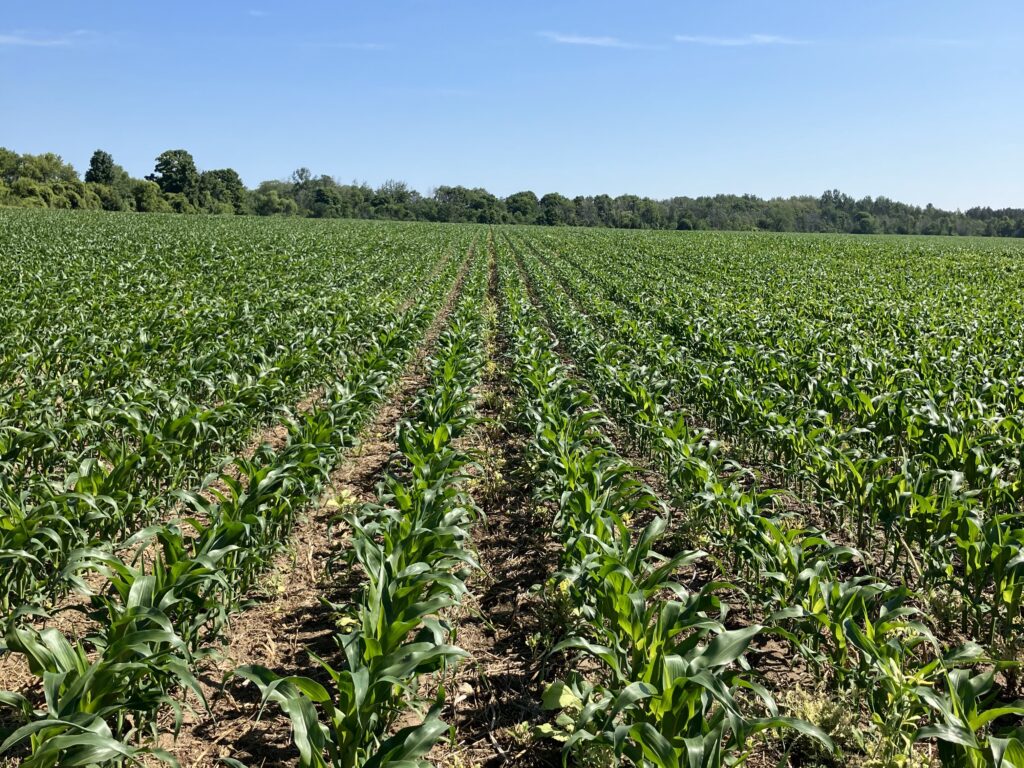
Field notes:
- Planted into moisture at consistent 2.2-inch depth with good slot closure
- Strong, uniform corn stand with very few gaps
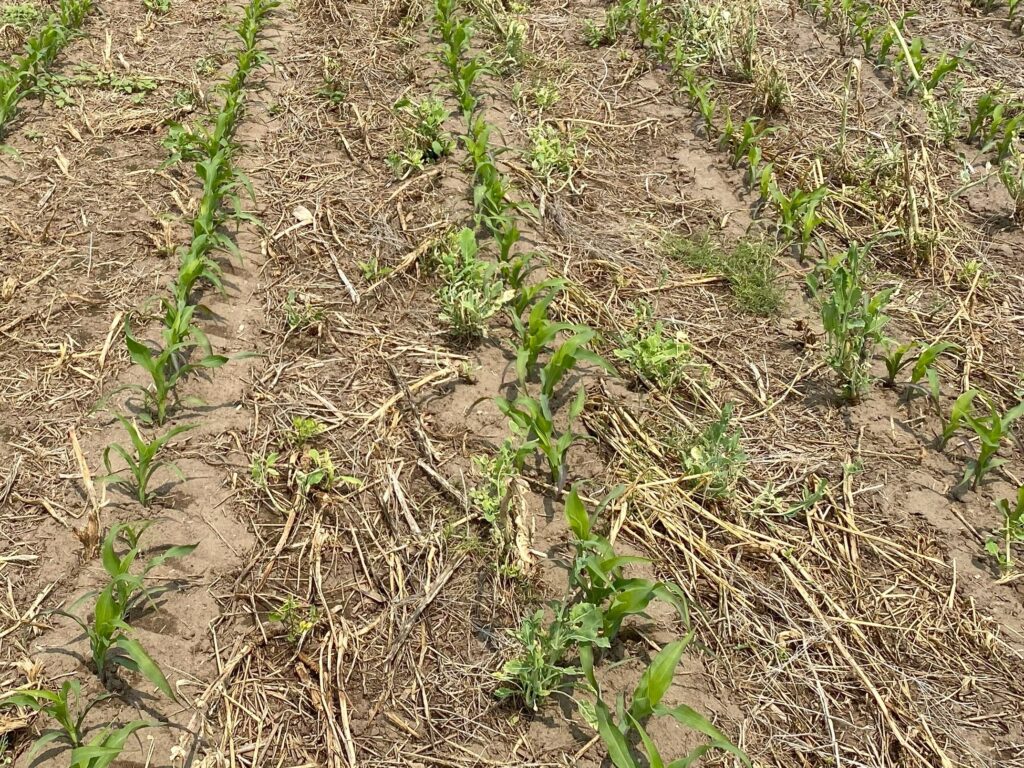
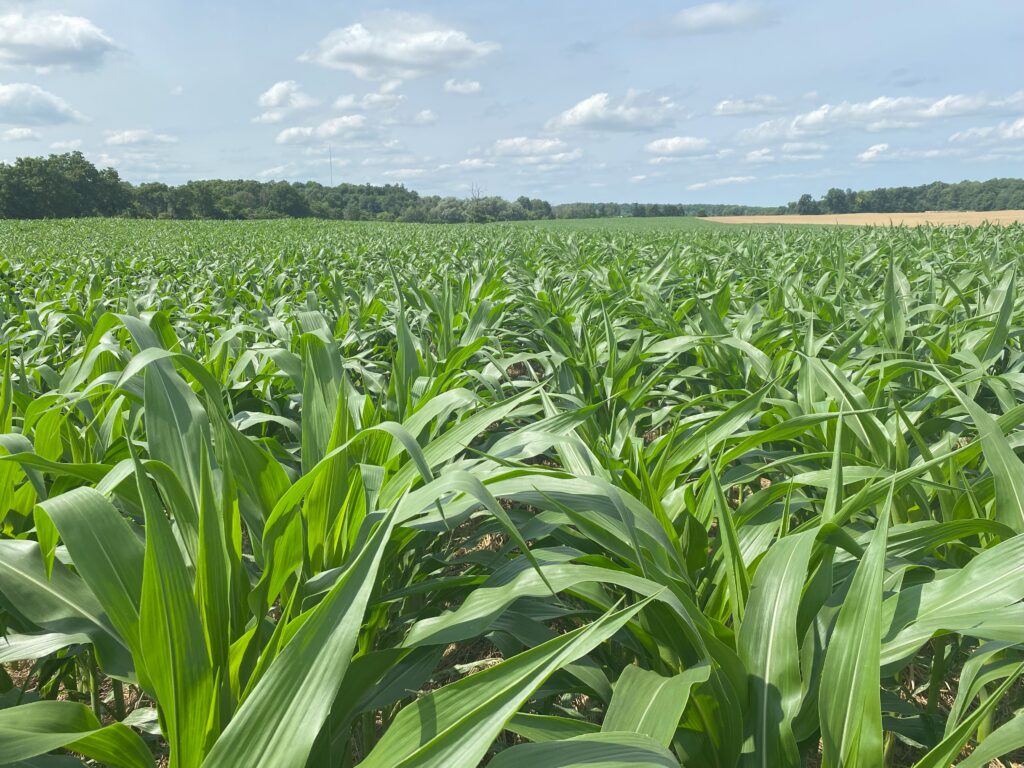
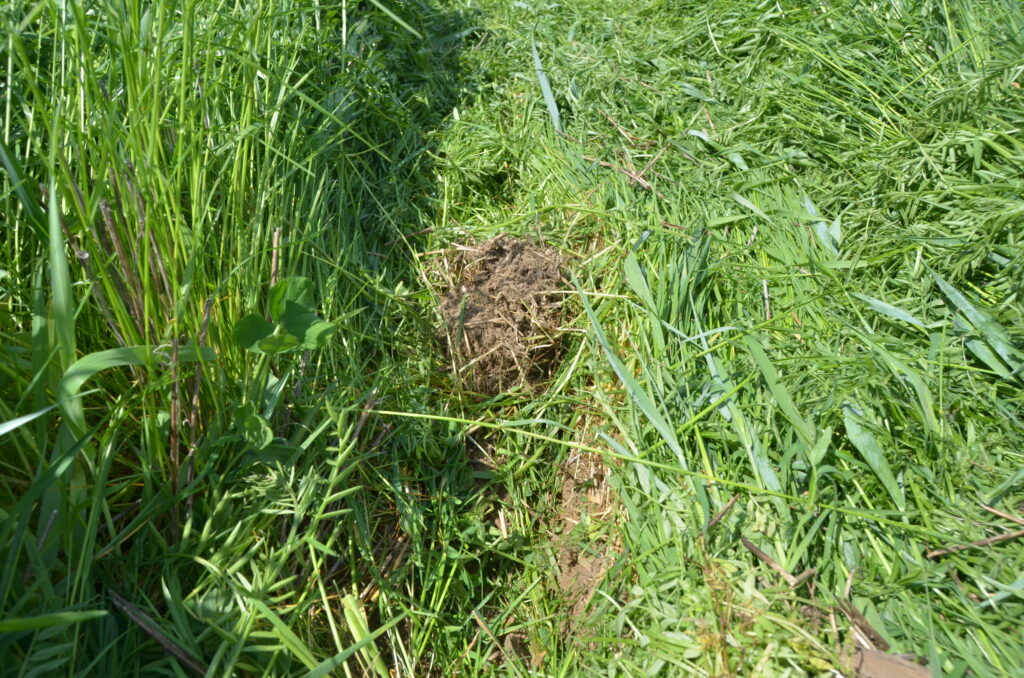
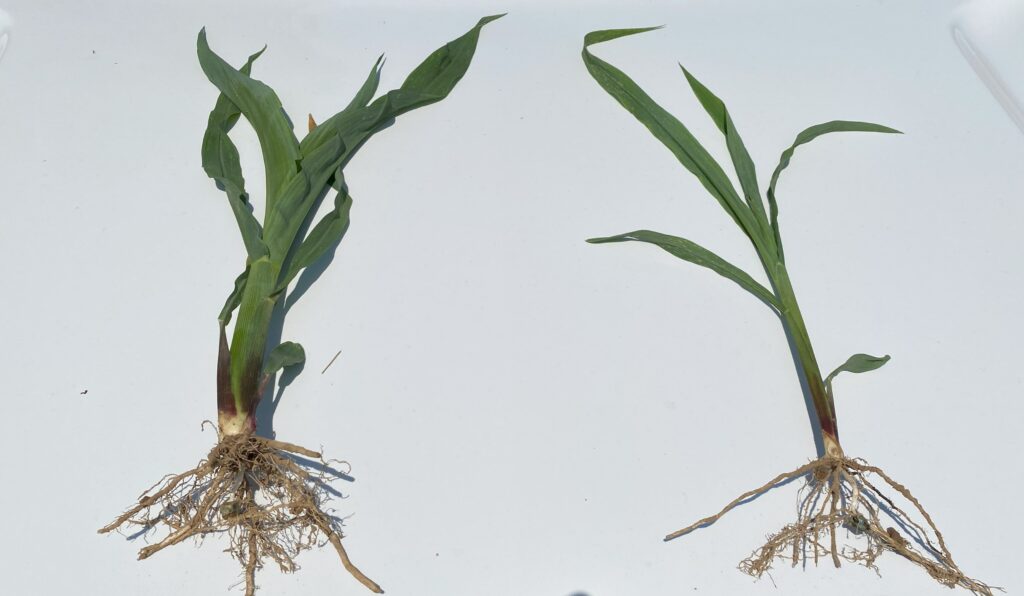
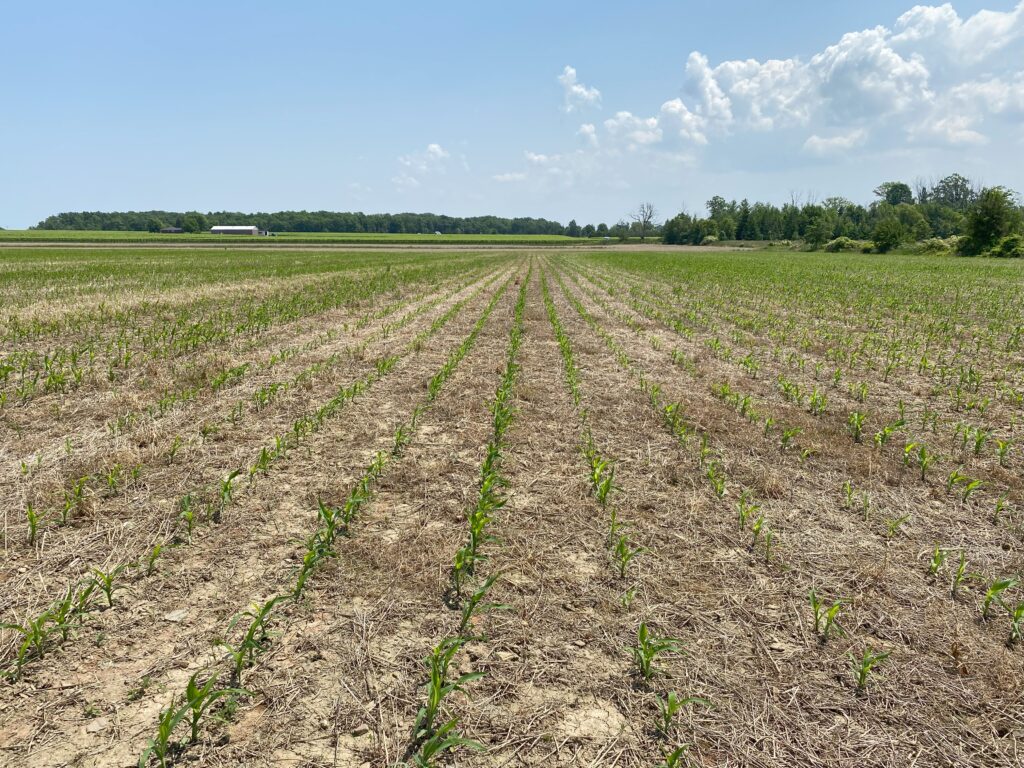
- Delayed corn development in rows within standing, untramped cover crop and volunteer wheat (one growth stage behind and 3 inches shorter)
- Burndown did not completely kill all hairy vetch plants (limited number of escapes)
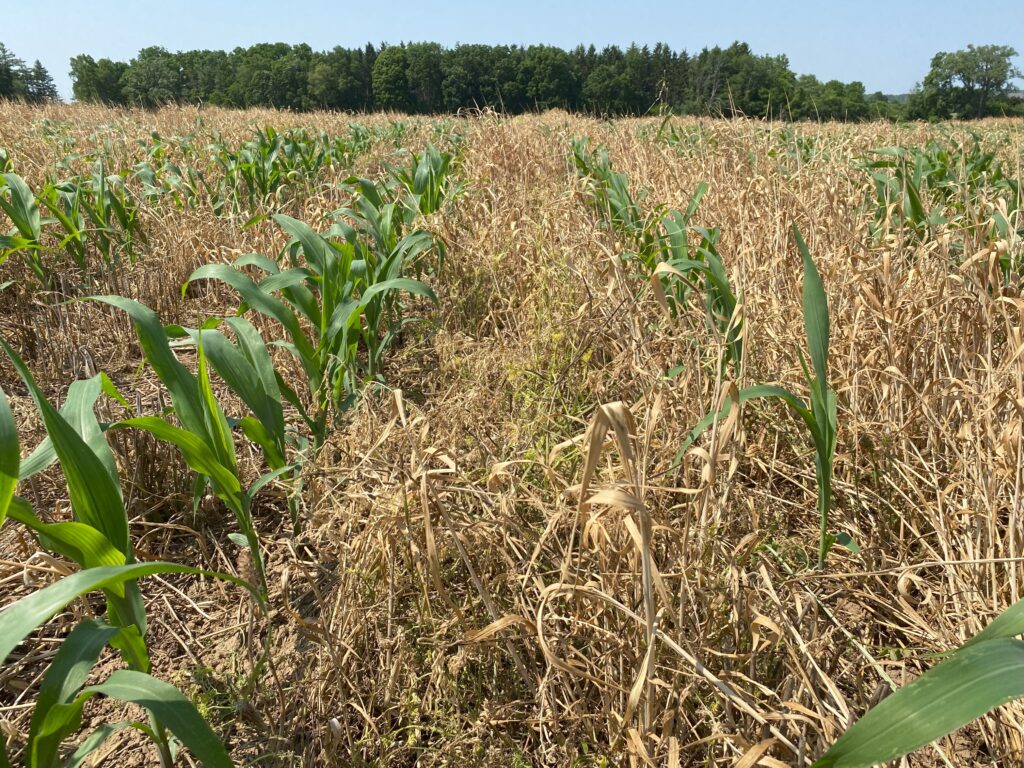
thicker cover crop (right)
Field 4 – Haldimand
- Corn yield: 173.6 bu/ac
- Planted DKC46-40 on May 24th at a rate of 36,000 seeds/acre with a John Deere 7000 planter:
- Unit-mounted coulter
- Heavy duty down-pressure springs
- Furrow Cruiser closing wheels
- Sprayed cover crop with Roundup and Acuron on May 25th
- 140 lbs/ac commercial nitrogen applied (+ manure N contribution)
- 20 lbs/ac nitrogen applied at planting:
- 20 lbs-N/ac applied in 2×2 band
- 120 lbs/ac nitrogen knifed in as sidedress application
- 20 lbs/ac nitrogen applied at planting:
- Cover crop roller crimped on May 31st
Final stand: 29,800 plants/acre
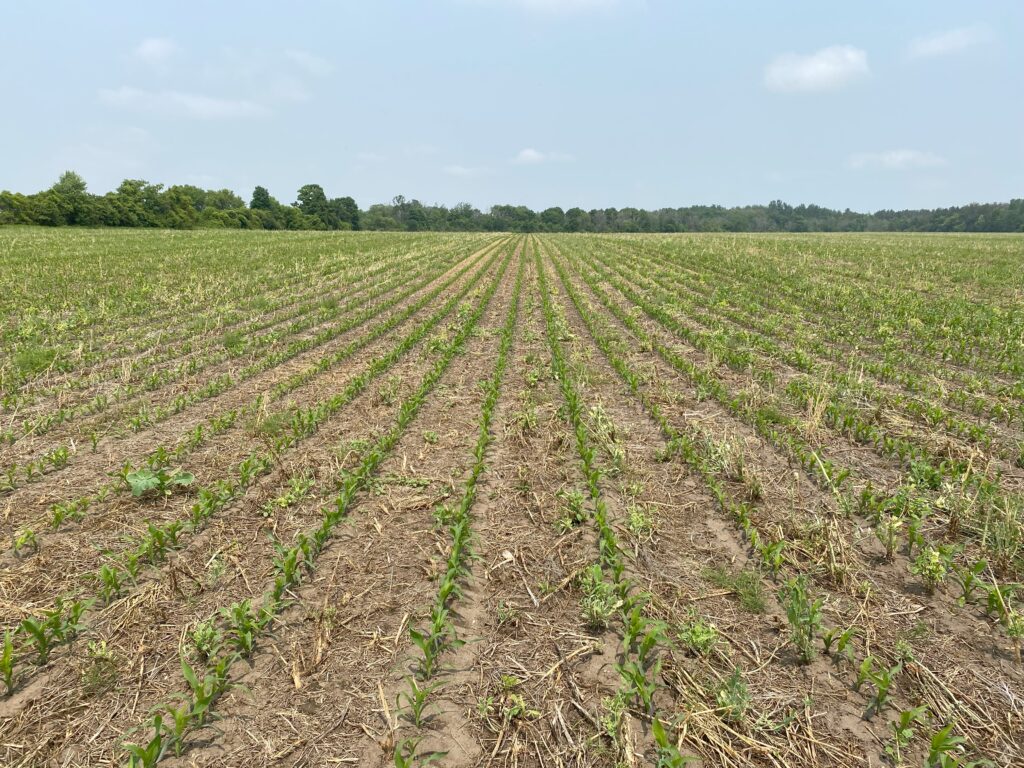
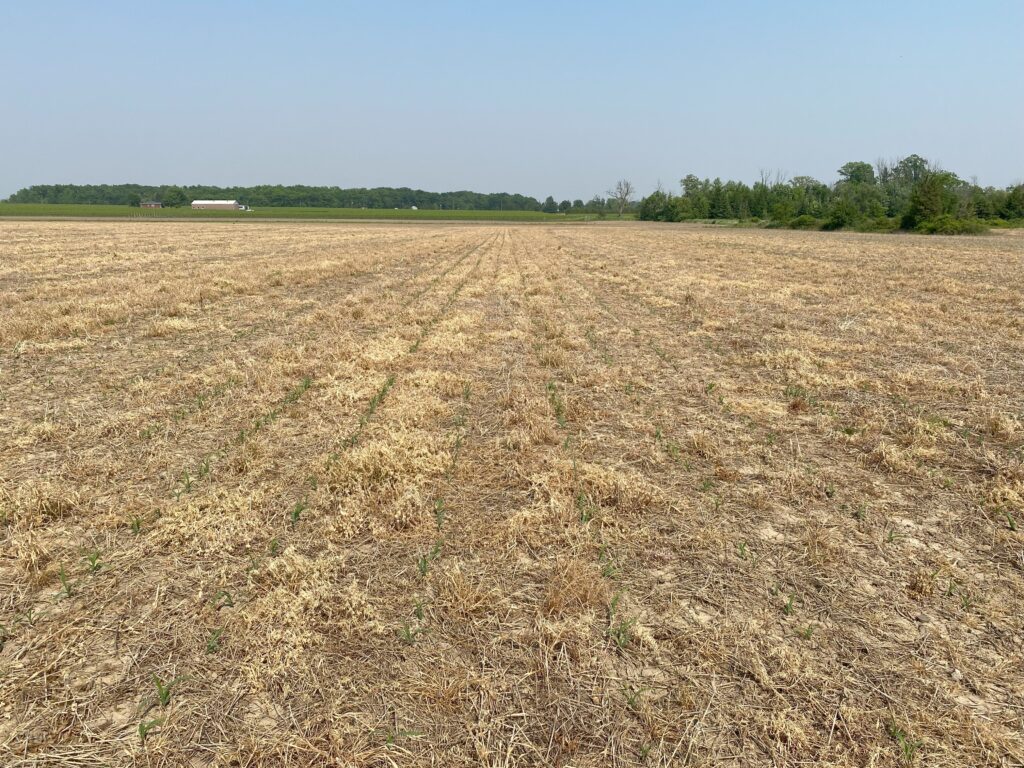
Field notes:
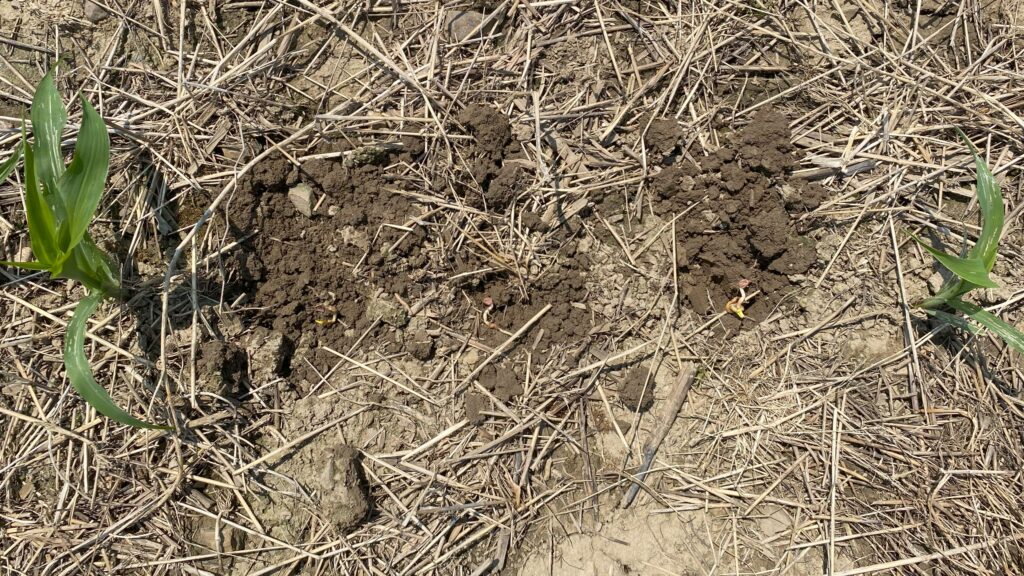
- Planter did a good job of planting to a 2-inch depth and closing seed slot, though some slots opened up under dry conditions in weeks following
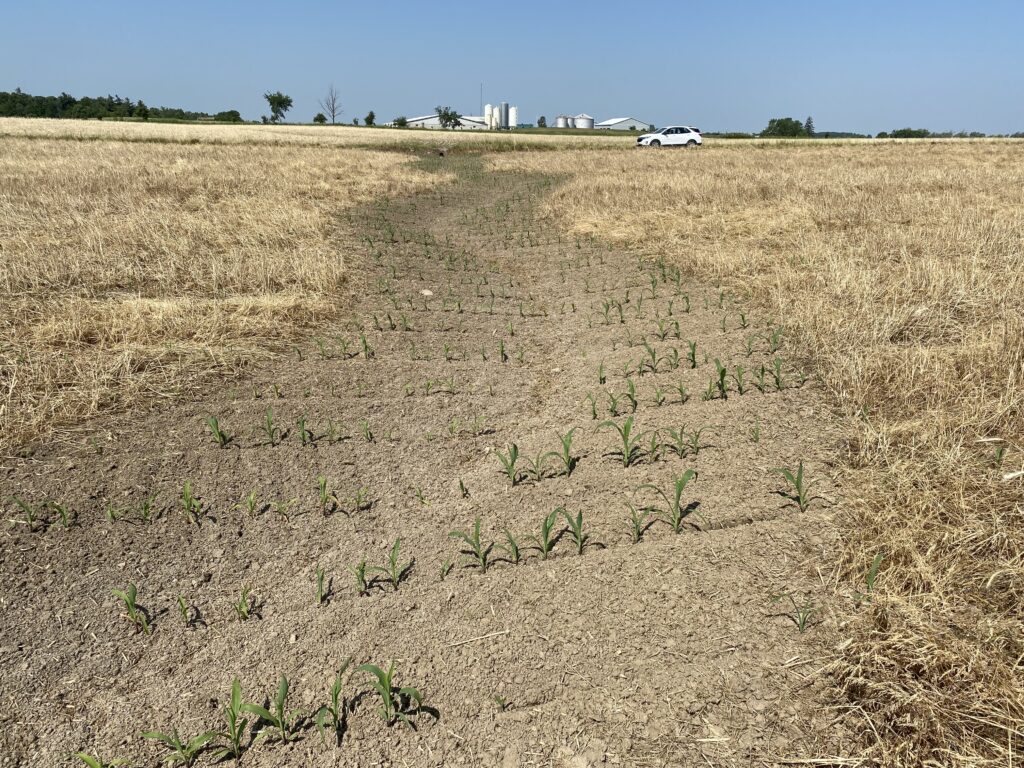
- Silty clay soil dried out and there was not enough moisture for corn seeds to germinate
- Field received only ~10 mm of rainfall on May 19th and then no rain until ~30 mm from June 10th-12th
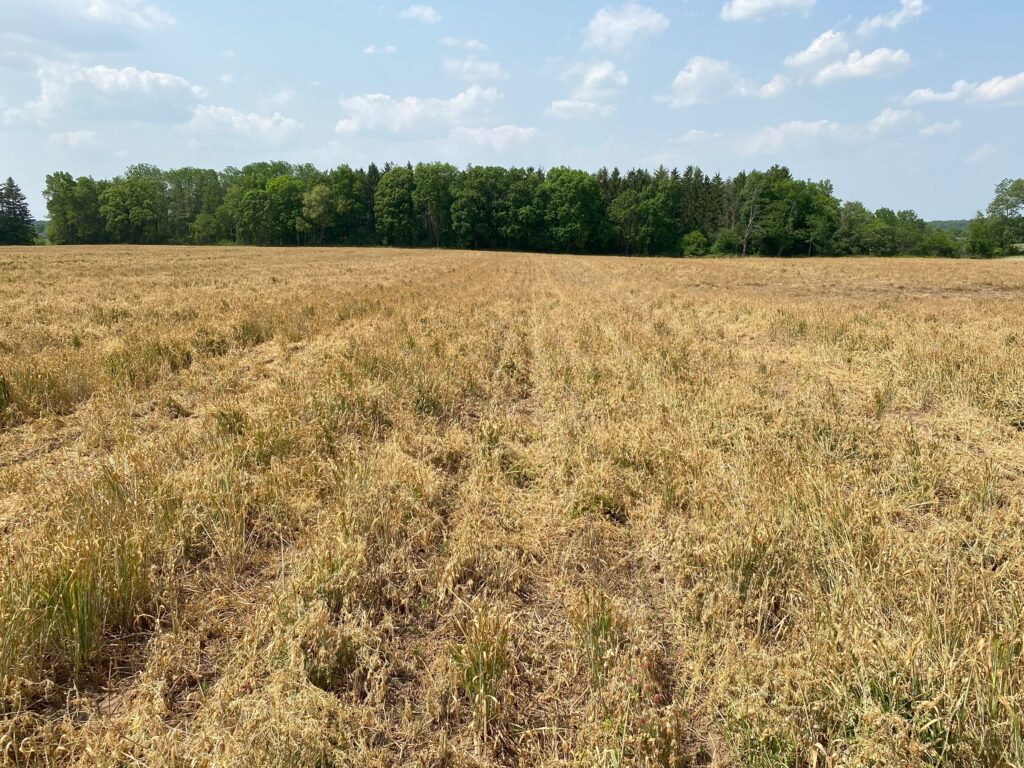
- Cover crop accelerated drying of the soil, as demonstrated by emerged corn in low residue parts of field.
- Corn emerged following June 10th-12th rainfall
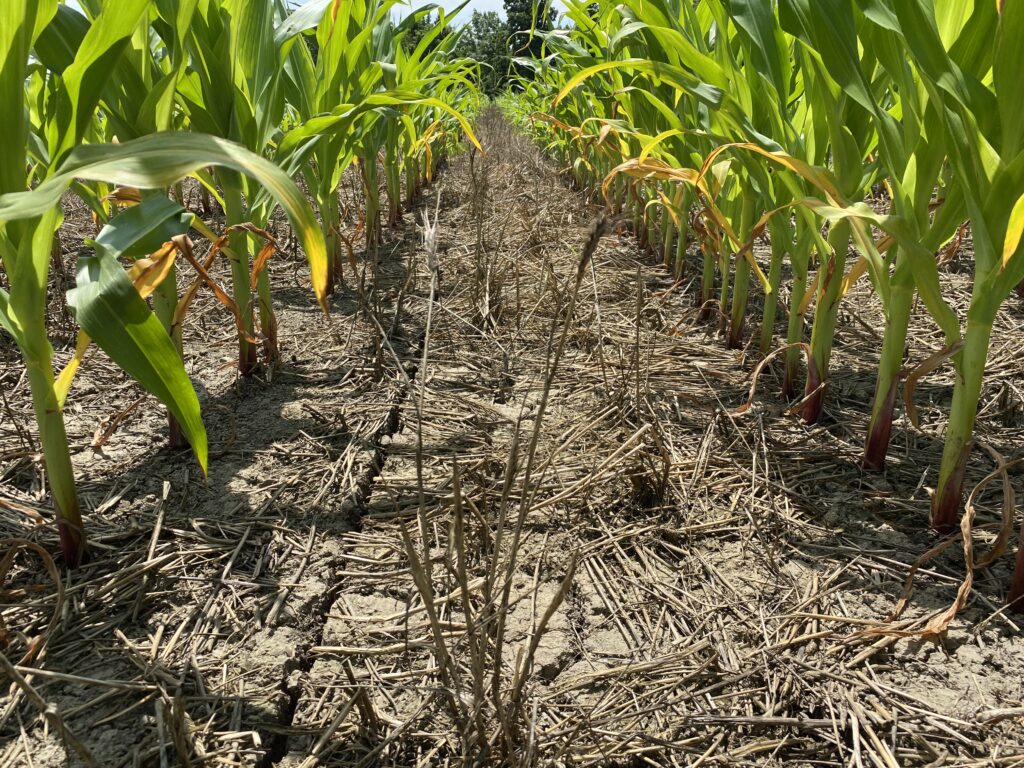
- Nitrogen deficiency symptoms in corn due to delayed side-dressing (farmer was unsure whether corn crop would emerge, then rainfall kept him out of field)
- Corn responded to July 10th UAN side-dress application and ample soil moisture, but remained delayed in development
Field 5 – Niagara
- Corn yield: 175 bu/ac
- Planted A6572 on May 19th at rate of 31,000 seeds/acre with a Horsch Maestro planter:
- Planter-mounted roller crimpers
- Hydraulic downforce
- Furrow CruiserXtreme closing wheels
- Sprayed cover crop with Glyphosate and Integrity (plus Merge and Interlock) on May 23rd
- 138 lbs/ac commercial nitrogen applied
- 48 lbs/ac nitrogen applied at planting:
- 3 lbs-N/ac applied in furrow
- 45 lbs-N/ac 28% UAN dribbled 3 inches beside corn row
- 90 lbs/ac nitrogen applied as side-dress (dribbled on surface with urease inhibitor)
- 48 lbs/ac nitrogen applied at planting:
Final stand: 21,900 plants/acre
Field notes:
- Field received 1.7-inch rainfall on May 19th-20th (immediately after planting)
- Lowest stand of all sites, though it was in line with many reported corn stands in the region
- Seeding depth of 2.25 inches
- Seed slot remained closed
- Corkscrewed corn observed at several gaps in stand
- Some hairy vetch and Italian ryegrass escaped burndown
Plant stands, uniformity, and yields
Plant stands and uniformity
Field 1 – a sandy loam – achieved the highest final corn stand and the greatest percentage of seeding rate, while Field 5 – a clay loam – had the lowest (Table 3). Soil texture played into this, as reports of poor corn stands were widespread on the clay-based soils of the Niagara region.
Field 3 in Brant County also had a strong stand, in part due to farmer experience and planter technology (e.g., row-by-row hydraulic down force). Field 4 – Haldimand, highlighted the challenges associated with clay soils and overwintering cover crops. Excess soil drying delayed corn emergence and it was fortunate that almost 30,000 plants emerged thanks to a timely, soaking rain in the first half of June. And finally, Field 2 illustrated the risks planting into big biomass cover crops – 4,000 plants per acre were lost, in some cases creating large stand gaps.
Field 1 also had the most uniform stand – with the highest percentage of plants at the primary growth stage (Table 3). It is a sandy loam texture as compared to the loam and clay-based soils at Fields 2-5 and had only modest cover crop growth, due in part to a low cover crop seeding rate. It was also the only strip-tilled site. Tilling the planting zone can be an effective strategy to improve corn stand and uniformity when planting green.
Table 3. Plant stand and uniformity statistics.
| Field | Final stand (plants/acre) | Stand % of seeding rate | % of plants at primary growth stage (mid-June) |
| Field 1 – Bruce | 33,200 | 98 | 89 |
| Field 2 – Brant | 29,600 | 88 | 83 |
| Field 3 – Brant | 30,500 | 92 | 55 |
| Field 4 – Haldimand | 29,800 | 83 | 76* |
| Field 5 – Niagara | 21,900 | 71 | 55 |
| Average | 29,000 | 86 | 72 |
Yield
Despite a very dry start, 2023 was an excellent growing season for corn in southwestern Ontario. Yields across the five sites reflected this. Even with less-than-ideal stands and early season growth at some sites, final yields approached or surpassed 200 bushels per acre. On average, plant green corn yields were 28 bu/ac higher than the combined county averages.
Table 4. Corn yields compared to county averages.
| Field | Yield (bu/ac) (15.5% moisture) | County average yield (bu/ac)1 |
| Field 1 – Bruce | 194.3 | 168.4 |
| Field 2 – Brant | 209.4 | 170.4 |
| Field 3- Brant | 216* | 170.4 |
| Field 4 – Haldimand | 173.6 | – |
| Field 5 – Niagara | 175 | 153.6 |
| Average | 193.7 | 165.7 |
Takeaways
As seen through these five fields, planting corn green into cover crop mixtures can work in Ontario. It does, however, require an advanced level of management, and can carry a higher level of risk.
Weather conditions in May challenged both clay-based sites (4 and 5), contributing to the lowest stands as a percentage of seeding rate. Field 4 in Haldimand illustrated a very real risk of planting green on such soils – cover crops can dry out soil rapidly in spring. This risk can be mitigated by seeding cover crops at lower rates, being prompt with crop planting and cover crop termination, or by pulling overwintering species out of the mixture.
At Field 2 in Brant, big cover crop growth contributed to issues, although the crop still yielded over 200 bu/ac. The grower seeded the same mixture at a lower rate following wheat this past summer to lessen planting challenges in 2024. The better corn stand and higher yield at Field 3 – managed by a nearby grower with more experience – highlighted the benefits afforded by more a modest cover crop, along with planter upgrades such as row-by-row hydraulic downforce.
And finally, cover crop escapes from burndown applications at four of five sites showed the trade-offs associated with planting green. Allowing for advanced growth of certain cover crops, in particular ryegrasses, hairy vetch, and brassicas, can be at odds with herbicide efficacy. Being clear on the role for each species can inform decisions on whether to remove certain harder-to-control cover crops from a mixture.
Key takeaways included:
- Target modest spring cover crop growth to maximize benefits while reducing planting challenges. Consider cover crop seeding rate, date, number of overwintering species, and nutrient availability from manure.
- Modify planter for better corn stands, especially in a no-till-plant green environment.
- Pneumatic downforce enables adjustments from the cab based on conditions. Hydraulic downforce provides greatest ability to place seed to proper depth in thick, living plant material.
- All farmers employed some form of aftermarket closing wheel system to achieve seed slot closure.
- Apply a higher-than-standard upfront nitrogen rate. Four of five growers applied an upfront nitrogen rate over 45 lbs-N/acre. Ample early nitrogen is critical when planting green to help overcome nitrate tie-up by non-legume cover crops and compensate for cooler, slower-to-mineralize soils early. Band nitrogen and protect any surface-applied N with a urease inhibitor.
- Match burndown herbicides and rates to control all species in mix (or adjust composition of mixture). Full coverage also becomes more challenging in thicker cover crops.
Planting corn green into a living cover crop is not for every farmer. Know your risk tolerance and consider which goals the system may help you achieve. Find other growers to learn from and begin by experimenting on a small acreage.
Thank you to the farmer cooperators who provided access to their fields and shared their production information for this case study.