Quote of the week:
“You can have a 2000 bushel grain cart, but man, it squeezes!” – Adam Pfeffer – concerning the compaction that large equipment can cause in-field.
The first agribusiness breakfast meeting of the year kicked off in Ridgetown on April 16, 2024. For the schedule of local meetings across Ontario, contact margaret.templeman@ontario.ca .
Conditions
What looked like an early spring back in February and March has turned into more of a normal time frame after all. Weather has been inconsistent but mostly warmer, while recent rains ranged from 25 mm in the southwest to 200 mm in central Ontario have slowed down most field work.
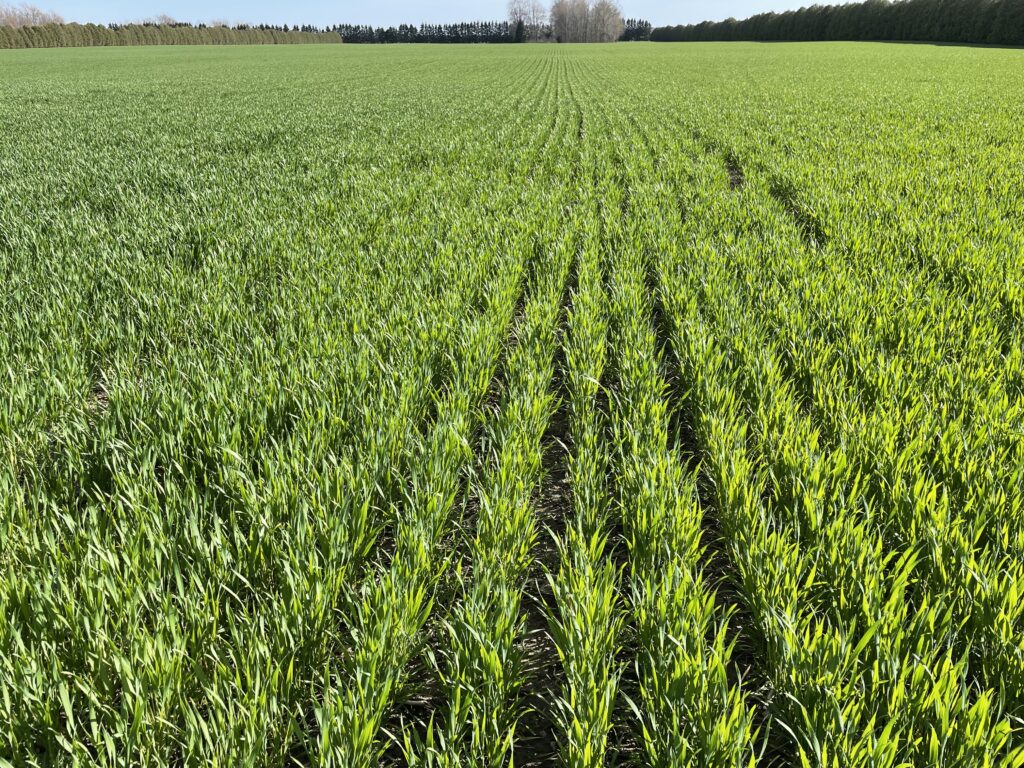
Winter Wheat
Winter wheat conditions range from excellent in the southwest to poor in some areas further north and east. Wheat that has been stressed from saturated soils has led to reports of some planned termination, although this decision must be made on a field-by-field basis. Scout your fields if you have not already! It is a great opportunity to evaluate your drill’s performance and make future adjustments if needed.
A mild winter and early spring have led to above normal growing degree days resulting in wheat development being 2 weeks ahead of normal (Table 1). Dale Cowan (Agris Co-op) reported 310 CHU accumulated starting Jan. 1 vs 245 CHU last year, which was also above long-term average.
Reports of some very early planted wheat in Essex and Chatham-Kent already at growth stage 31, means that nitrogen applications, herbicide, fungicides, and plant growth regulators (PGRs) have to be on top of mind. Most of the wheat crop in the area has not yet reached this stage, although fields that received an early N application look to be showing visual response already.
| Location | 2024 | 10-year average |
|---|---|---|
| Windsor | 373 | 185 |
| Ridgetown | 333 | 139 |
| Sarnia | 314 | 126 |
| London | 304 | 110 |
| Kitchener-Waterloo | 251 | 137 |
| Elora | 232 | 66 |
| Goderich | 279 | 80 |
There have been a few narrow windows so far this spring for nitrogen (N) and sulphur (S) application, and the first few days of the week of April 8 allowed some growers in the southwest to apply N. In terms of N applications in the southwest, to date ranges from 30-75% of fields having received some N, with the majority being split applications. Visually, there have been some big differences in fields receiving early N, as well as some fields with strip trials of spring applied MAP. Whether this visual difference translates to increased yield remains to be seen.
Early planted, thick wheat may have some concerns for lodging, especially if planted into a variety with more marginal standability and counts of over 75 stems/ft2. PGRs may have a fit in some cases.
Corn and Soybeans
Corn acreage may decrease by a small amount in the southwest as growers aim to plant more soybeans on soils less suited for corn production. But like every year, if conditions are right, corn will be planted! IP soybeans acres may increase, but growers are reminded that early season weed control is an absolute must. There are few options for post-emergence herbicides, and no options for problem weeds such as glyphosate-resistant Canada fleabane.
Horticultural Crops
Sugar beet growers have begun planting, with roughly 1300 acres in the ground so far, most fields prior to last week’s rain event. One ultra-early planted sugar beet field looks very good, as weather has worked in its favour so far.
Tomato acreage looks to be down marginally, and contracted price has decreased. Tomato growers and agronomists are concerned with the emergence of Phytophthora capsici, a disease that was widespread in tomatoes in 2023 with persistent rainfall. This disease also affects peppers and vine crops, so growers should be prepared for preventative control. It was noted that the horticultural pathologist vacancy at Ridgetown is a concern by industry and growers!
Weed control
Research in Quebec has confirmed a population of glyphosate-resistant lambsquarters. To date though, no Ontario lambsquarters biotype has been confirmed as glyphosate resistant.
Warm weather early this spring has made for good growing conditions for weeds as well, particularly problem weeds such as glyphosate-resistant Canada fleabane. Urgency may be required for burndowns if weeds are getting large, as increased size can lead to decreased control with many weeds. Growers are encouraged to scout fields early for weed size and pressure.
For IP soybeans, it is critical to plan soil-applied herbicide that meets the specific weed spectrum of the field, and then manage escapes as needed. Good strategy over-all.
Nitrogen loss in wet conditions
With the recent rains, there have been questions about the potential losses of N from applications to winter wheat. Rate of nitrogen loss depends on several factors, including:
- Form of N fertilizer
- Rate applied
- Application timing
- Precipitation received
- Soil texture
- Temperature
In general, volatilization losses are expected to be quite low – there has been enough precipitation to move N into the soil profile where it is protected. Denitrification may be the larger concern due to wet conditions, especially on heavier clay soils, but cool soil temperatures have mitigated the loss potential. Table 2 shows the effect that soil temperature has on denitrification losses in saturated conditions.
| Soil Temperature (°C) | Potential denitrification rate (percentage of N03-N in soil) |
|---|---|
| < 12 | 1% – 2% per day |
| 12 to 18 | 2% – 3% per day |
| > 18 | 4% – 5% per day |
On lighter sandy soils, nitrate leaching is the more dominant form of loss, but is likely not a major concern for most of the province. In areas with extreme rainfall events, there is potential for movement of nitrate out of the rooting zone through the soil profile, but loss is dependent on the rate of soil infiltration. A week of steady rain equating to 125mm (5”) will move nitrate further down in the soil profile than a single rainfall event of the same amount. A deep, healthy root system may still pick up nitrate that has moved downward assuming it hasn’t left via tile drains.
The timing of application is important as well. Urea fertilizer may take 7-14 days to be converted to nitrate, which is the form of N that can be lost via denitrification or leaching. Split application is a way to reduce the risk of N loss from early season applications and gives an opportunity to adjust rates later in season depending on crop conditions.
Agricorp update
Through the southwest (Essex, Kent, Lambton), there have been 21 reports of damage in winter wheat totaling 1600 acres, mainly from excessive rain. This equates to 1.05% of insured acres. There have also been four reports of damage to winter canola, three from winterkill and one incidence of slug damage, representing approximately 240 acres. A reminder that a damage report does not necessarily mean a claim will be paid.
Upcoming deadlines:
- April 30, 2024 – apply for AgriStability
- May 10, 2024 – apply/change coverage for production insurance
- apply for production loss coverage for winter wheat (if planted past deadline in fall)
- Apply/change, and pay premiums for Forage Rainfall coverage
Please visit Agricorp.com for up-to-date information.
Weather Data – April 8-14, 2024
| Highest Temp (°C) | Lowest Temp (°C) | Rain for Week (mm) | Rain (mm) April 1st | GDD0C April 1st | GDD5C April 1st | |
|---|---|---|---|---|---|---|
| HARROW | ||||||
| 2024 | 25.3 | 5.7 | 33.4 | 58.7 | 130 | 60 |
| 2023 | 21.5 | -2.5 | 10.7 | 10.7 | 56 | 23 |
| 2022 | 12.0 | -0.3 | 13.0 | 16.0 | 44 | 8 |
| 10-yr Norm (11-20) | 13.2 | -1.2 | 19.8 | 24.9 | 61 | 12 |
| RIDGETOWN | ||||||
| 2024 | 25.1 | 4.5 | 49.9 | 66.1 | 117 | 50 |
| 2023 | 20.4 | -4.1 | 50.7 | 50.7 | 49 | 21 |
| 2022 | 12.6 | -2.3 | 7.8 | 8.0 | 36 | 6 |
| 10-yr Norm (11-20) | 12.4 | -2.5 | 19.8 | 25.7 | 51 | 6 |
| SARNIA | ||||||
| 2024 | 24.1 | 4.5 | 35.5 | 48.9 | 113 | 49 |
| 2023 | 20.3 | -4.4 | 44.6 | 44.6 | 48 | 18 |
| 2022 | 14.5 | -2.6 | 13.8 | 14.2 | 33 | 5 |
| 10-yr Norm (11-20) | 12.4 | -1.9 | 19.8 | 26.2 | 47 | 5 |
| LONDON | ||||||
| 2024 | 22.4 | 3.1 | 45.0 | 59.7 | 116 | 49 |
| 2023 | 17.8 | -4.3 | 49.6 | 49.6 | 44 | 16 |
| 2022 | 16.1 | -4.2 | 13.9 | 14.7 | 35 | 9 |
| 10-yr Norm (11-20) | 11.7 | -2.7 | 21.9 | 31.5 | 43 | 3 |
| BRANTFORD | ||||||
| 2024 | 23.5 | 1.6 | 34.8 | 44.9 | 107 | 43 |
| 2023 | 15.8 | -6.3 | 43.5 | 43.5 | 39 | 12 |
| 2022 | 15.1 | -4.3 | 5.2 | 5.5 | 38 | 11 |
| WELLAND | ||||||
| 2024 | 24.3 | 1.5 | 55.3 | 87.7 | 121 | 54 |
| 2023 | 15.7 | -4.4 | 37.3 | 37.3 | 47 | 18 |
| 2022 | 18.1 | -2.7 | 4.6 | 5.2 | 49 | 16 |
| 10-yr Norm (11-20) | 12.0 | -2.1 | 21.5 | 30.7 | 45 | 3 |
| GODERICH | ||||||
| 2024 | 23.2 | 0.6 | 36.7 | 50.2 | 101 | 39 |
| 2023 | 17.3 | -6.4 | 19.4 | 19.4 | 36 | 12 |
| 2022 | 14.5 | -3.2 | 13.6 | 15.1 | 31 | 7 |
| 10-yr Norm (11-20) | 10.4 | -3.1 | 16.1 | 22.4 | 34 | 1 |
| ELORA | ||||||
| 2024 | 22.5 | 1.6 | 34.8 | 54.6 | 94 | 34 |
| 2023 | 15.5 | -6.7 | 14.0 | 14.0 | 31 | 7 |
| 2022 | 13.7 | -4.0 | 12.4 | 13.5 | 31 | 7 |
| 10-yr Norm (11-20) | 10.3 | -3.8 | 19.7 | 30.8 | 30 | 0 |
| MOUNT FOREST | ||||||
| 2024 | 21.7 | 1.4 | 65.9 | 81.2 | 92 | 33 |
| 2023 | 15.4 | -7.0 | 28.4 | 28.4 | 32 | 8 |
| 2022 | 13.3 | -3.3 | 17.6 | 19.8 | 30 | 7 |
| 10-yr Norm (11-20) | 9.7 | -4.6 | 18.1 | 27.2 | 23 | 0 |
| BARRIE | ||||||
| 2024 | 21.1 | 0.0 | 66.9 | 126.9 | 82 | 25 |
| 2023 | 10.7 | -7.5 | 28.0 | 28.3 | 21 | 0 |
| 2022 | 13.1 | -3.2 | 17.2 | 17.2 | 37 | 8 |
| 10-yr Norm (11-20) | 9.1 | -4.7 | 16.6 | 24.8 | 23 | 0 |
| PETERBOROUGH | ||||||
| 2024 | 22.4 | -2.6 | 54.0 | 92.6 | 96 | 34 |
| 2023 | 13.6 | -6.5 | 28.2 | 28.2 | 27 | 4 |
| 2022 | 15.3 | -4.1 | 7.6 | 7.6 | 39 | 8 |
| 10-yr Norm (11-20) | 10.7 | -3.4 | 15.2 | 23.6 | 31 | 0 |
| KEMPTVILLE | ||||||
| 2024 | 21.7 | -0.8 | 30.8 | 81.3 | 91 | 33 |
| 2023 | 11.7 | -7.1 | 64.9 | 64.9 | 17 | 1 |
| 2022 | 17.2 | -2.0 | 43.3 | 43.3 | 47 | 8 |
| 10-yr Norm (11-20) | 10.8 | -3.8 | 21.5 | 30.2 | 30 | 1 |
| SUDBURY | ||||||
| 2024 | 20.4 | 0.0 | 64.7 | 101.6 | 69 | 18 |
| 2023 | 7.6 | -11.5 | 29.7 | 30.3 | 3 | 0 |
| 2022 | 10.9 | -4.9 | 14.5 | 14.9 | 16 | 1 |
| 10-yr Norm (11-20) | 7.0 | -7.9 | 18.1 | 30.4 | 3 | 0 |
| EARLTON | ||||||
| 2024 | 18.8 | -2.8 | 69.8 | 99.9 | 62 | 15 |
| 2023 | 7.8 | -15.2 | 13.5 | 13.6 | 0 | 0 |
| 2022 | 8.1 | -3.8 | 10.2 | 12.0 | 15 | 0 |
| 10-yr Norm (11-20) | 5.1 | -10.0 | 14.6 | 20.5 | 0 | 0 |
| SAULT STE MARIE | ||||||
| 2024 | 17.2 | 0.7 | 24.4 | 54.3 | 71 | 15 |
| 2023 | 6.6 | -8.4 | 16.9 | 17.4 | 7 | 0 |
| 2022 | 7.7 | -4.5 | 37.1 | 40.7 | 13 | 0 |
| 10-yr Norm (11-20) | 6.1 | -7.8 | 18.9 | 26.2 | 4 | 0 |
| THUNDER BAY | ||||||
| 2024 | 17.0 | -3.8 | 9.8 | 9.8 | 51 | 7 |
| 2023 | 13.8 | -13.6 | 14.1 | 17.8 | 3 | 0 |
| 2022 | 9.8 | -5.3 | 31.4 | 32.1 | 12 | 0 |
| 10-yr Norm (11-20) | 7.7 | -9.5 | 8.8 | 14.2 | 5 | 0 |
| FORT FRANCES | ||||||
| 2024 | 15.9 | -4.8 | 4.1 | 4.1 | 54 | 4 |
| 2023 | 14.4 | -21.8 | 8.0 | 11.9 | 9 | 2 |
| 2022 | 8.8 | -9.8 | 28.1 | 28.2 | 10 | 0 |
| 10-yr Norm (11-20) | 7.7 | -10.0 | 8.6 | 13.3 | 7 | 0 |