This post discusses some of the results from one of the variable rate nitrogen trials on an Oxford County corn field. The background on this trial can be found in an earlier post. This farm was recently purchased so the producer had very little history, one year of yield data, and elevation was a limiting factor to crop productivity (i.e. large knoll west side of field with extreme slope 45-70%). Zones were created based on topographic features of the field and then soil sampled (i.e. fertility and surface texture composite across each zone). A new Nitrogen Potential Assessment soil test (NPA – Brookside Laboratories, Ontario Accredited) was also done in early spring for each sample/zone. Using the farmers’ yield goal (200-210bu) and the NPA results, a prescription map was created by Premier Equipment for the field’s nitrogen requirements (Figure 1).
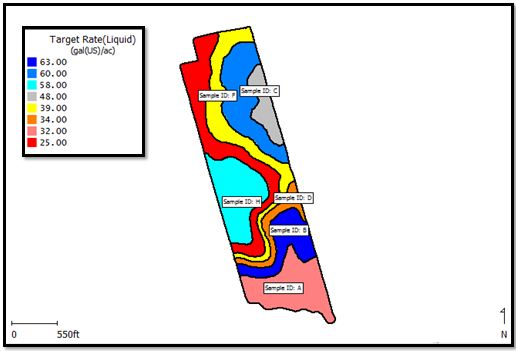
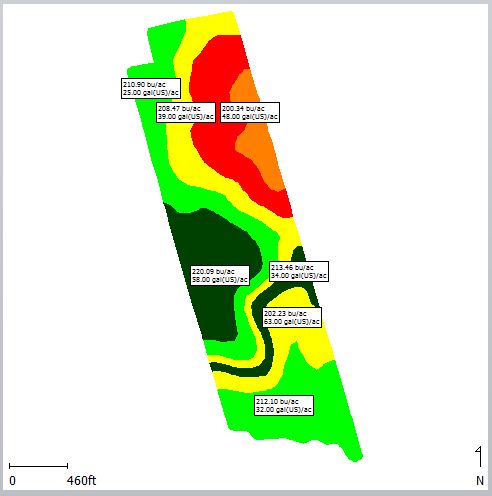
Figure 2 is a compiled map, which combines the yield map composed of thousands of yield points collected during harvest and the prescription zone map used for N application. In the northeast management zones (shown as red and orange labelled 200.34bu / 48gal) yields were the lowest overall. Comparing to last year’s soybean yield map, and in consultation with the co-operator, this area has known drainage issues and tends to hold water longer. In 2013, these two zones still achieved 200bu/ac with a moderate to high rate of N.
The zone on top of the large knoll on the west side of the field (shown as large dark green zone labelled 220.09bu / 58gal) also had a higher rate of N (i.e. highest economic investment, more environmental risk). This zone achieved an overall average of 220bu/ac which was 10bu higher than the field average. Given the yield response in 2013 this zone also had the highest N removal rate in the field. These zones could be considered the most variable depending on the growing season conditions (i.e. low poorly drained zone saturated in a wet year, and high top of knoll lower OM% zone prone to drought). Both zones were historically characterized by the co-operator as consistently poor yielding.
The graph below shows yield response in 3 management zones between conventional uniform rates and the variable rate nitrogen (VR-N) applications on either side of the uniform passes (Note: 2 rep’s were averaged). Purple bars (4th bar in each set) show the pass average across all management zones.

Observation #1 top of the knoll (red bars / 1st bar in each set) in Zone H (Loam – 2.3% OM) the yield ranges from 217 to 222bu/ac. The highest yield response (224 bu/ac) was in the pass with 170lbs of N applied uniformly. The VR-N recommendation of 224lbs based on the Nitrogen Potential Assessment and co-operator yield goal (200-210bu). Yield differences between uniform rates and VR-N on top of the knoll were not greater than a 10bu. In this zone for 2013, the lowest N rate of 110lbs/ac achieved 220bu a N cost savings for that zone (i.e. reduction of 114 lbs x 11 acres in that zone = 1254lbs N x $0.61 = $765 savings or $65 /ac). This would also result in less environmental risk.
Observation #2 north side of the field (dark blue bars / 2nd bar in each set) in Zone F (Silt Loam – 3.2% OM) yields were similar across the board (208 to 213 bu/ac). The VR-N pass on the east side of the zone (target rate of 167lbs/N) had slightly higher yield response (213bu).
Observation #3 south side of the field (green bars / 3rd bar in each set) in Zone A (Sandy Loam – 2.9%OM) the co-operator noticed there was a noticeably higher yields overall on south side of the field. The highest yield response (234bu/ac) was found in the VR-N pass (target rate of 146lbs). This is 15 bu/ac higher than the entire pass average which crossed all management zones (119 bu/ac).
Topographic management zones were developed on this field as a first step to developing a variable rate N management strategy. This project shows one growing season where corn had ample water supply during the reproductive period. Additional work should be done to fine tune the management zones used on this field (e.g. incorporate convex v.s. concave slope information keeping in mind zone size & variable rate N equipment capability). More growing seasons and additional yield and other data moving forward will further fine tune this process as the co-operator examines the costs and benefits of a precision agriculture strategy on this field.
Project Background: The Oxford Soil and Crop Improvement Association (SCIA) was a Water Resource Adaptation and Management Initiative (WRAMI) funding recipient from Farm and Foodcare. Premier Equipment Ltd. and OMAF and MRA specialists are assisting Oxford SCIA with two precision agriculture project objectives that increase producer preparedness in managing low and excess water conditions:
- site-specific nitrogen management in corn to reduce the potential of N leaching
- site-specific corn population strategy to improve water use efficiency and address soil moisture field variation effectively