The author of this article is Mary O’Connor, an OMAFRA summer student who, under the supervision of James Byrne (OMAFRA Beef Cattle Specialist), assisted with this project. The article was first published in the October 2021 edition of Virtual Beef.
Introduction
In Canada, grazing land, consisting of natural and planted pastures, accounts for approximately 50 million acres (Statistics Canada, 2011). Pastures provide numerous benefits to the producer, animals, and the surrounding environment. Grazing livestock on pasture provides economic benefits to the producer by supplying nutritious low-cost feed for livestock and utilizing marginal land not suitable for crop production (OMAFRA, 2015). Measuring and monitoring pasture growth on a regular basis can improve pasture performance, pasture productivity and livestock performance.
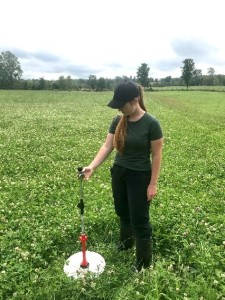
A rising plate meter is a tool that can assist producers in assessing the current state of their pastures, allowing them to make informed management decisions leading to better pasture and animal performance. The goal of this project was to demonstrate the effectiveness of measuring pasture using a rising plate meter at improving pasture management.
Materials and Methods
The primary site selected for this project was the Northwest Ranch at Victoria Community Pasture located in Hartley, ON. A secondary site, located in Nestleton ON, will be reported on later. The Northwest Ranch is 215 acres in size and is divided into eleven paddocks. The pasture was grazed by 110 heifers at a stocking rate of 0.51 animals per acre. Heifers consist of Angus, Simmental, Limousin, Charolais, and various crosses with an average weight of 625 lbs (284 kg). Heifers were turned out onto the Northwest Ranch for the 2021 grazing season in May and are still grazing this area. A rotational grazing system is implemented, with a rotation length of 32 days. The heifers have continuous access to an area know as the “swale” a low-lying area containing a water supply and access to minerals.
Measuring Pasture using a Rising Plate Meter
On a weekly basis, compressed sward heights were taken from each grazable area (P1, P2, P3, P4, P5, P6, P7, P8, P9, and P11) using a rising plate meter. A rising plate meter has a round plate that rises to a height based on the amount of forage beneath it and this height is used to estimate pasture quantity. As the rising plate meter is pressed down into the forage, it counts the number of notches the plate rises (each notch represents half a cm). The first step in sampling with the rising plate meter was recording the initial counter reading. Next, a zig-zag path was taken across each field, and samples were taken at each stride to provide an accurate representation of field conditions. After, the end counter reading and the number of samples were recorded. On average, 200 plate samples were taken per pasture. It’s important to take as many plate samples as practically possible to achieve best representation of the state of the, i.e., areas with long and short grasses must be proportionally represented. Taking a high number of plate meter samples per pasture helps reduce the impact of operator error. In addition, it’s important to follow the same rough track in each field each week where possible.

Grass Sampling
On a monthly basis, pasture density (kg DM per ha cm) and dry matter (%) figures were determined. To calculate pasture density and dry matter content ten pasture samples were taken from a randomly selected field (P2). A diagonal path across the field to take grass samples was chosen, along which, ten grass samples were taken every 30-40 paces. At each sample point a quadrat (50cm X 50cm) was randomly placed from where the grass sample was to be taken. Prior to cutting the grass sample within the quadrat, a pre-clipping plate meter reading was taken. Using a grass shears, the grass contained within the quadrat was cut to approximately 3.5 cm. The cut grass was then gathered and placed into a labelled Ziploc bag. The bag containing the sample was compressed to remove as much air as possible, sealed, and placed into a bookbag. After cutting, a post-clipping plate meter reading was taken and recorded.
Laboratory
The wet weight of each individual grass sample, less the weight of the bag, was recorded. Next, the grass samples were combined, and a 100 g subsample was extracted. The subsample was then dried using a Koster Tester to remove all moisture from the grass allowing the dry weight to be determined. After 40 minutes of drying, the sample was weighed and returned to the Koster Tester to dry for an additional 20 minutes. After 20 minutes, the sample was re-weighed. The final dry weight was recorded when the weight change of the sample was less than 2g. If the weight change was more than 2g the sample was returned to the dryer.
Data analysis
Dry matter content of the pasture was calculated from the grass samples by dividing the weight of the dried subsample by the initial weight of the subsample x 100, (%) The kg DM per ha was calculated by taking the average weight of the quadrat samples, in kgs, x DM% x 40,000. From this pasture density, (Kg DM Ha cm), was calculated by taking the pasture dry matter content (kgs/ha) / (average pre-clipping compressed sward height – average post-clipping compressed sward height). Knowledge of pasture density is key to the effective use of the rising plate meter. Pasture dry matter content (kg DM per ha) was calculated on a weekly basis for each pasture by taking the average pre-grazing compressed sward height (cm) x pasture density (kgs DM per ha cm). Growth rates were calculated by taking the current week’s pasture dry matter content (kg DM per ha) less previous week’s pasture dry matter content (kg DM per ha) / 7. As pasture conditions change over time, pasture density and dry matter content (%) were recalibrated monthly.
From these calculations a pasture wedge was generated showing current, recommended, and future grazing conditions. A pasture wedge is a visual representation of pasture quantity (represented by the columns) and animal demand (represented by the line). Columns above the line indicate pastures that have surplus grass for their position in the rotation whereas, columns below the line indicate pastures that are deficient in grass for their position in the rotation. The current grazing pasture wedge (figure 2) displays the producers’ original pasture rotation plan. The recommended grazing pasture wedge (figure 3) rearranges the pastures containing the highest dry matter content to the lowest.

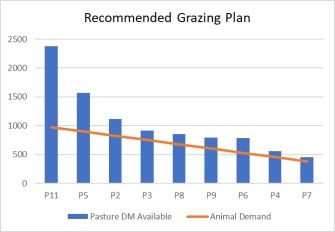
Rearranging the pastures to this new order, as shown in figure 2, enabled pastures with an abundance of grass to be grazed first allowing slower-growing pastures to catch up. A predicted pasture wedge was also generated which showed what pastures could look like into the future based on the individual pasture growth rate. A pasture wedge is a powerful pasture management tool as it enables producers to easily see what pastures as performing well, which are not growing fast enough and in what is the order should pastures be grazed. Using a pasture wedge increases the control producers have over the grazing of their pastures ensuring livestock always have access to an adequate supply.
Results/Discussion
The research conducted over the summer demonstrated the usefulness of measuring and monitoring pastures. The average pasture growth rate from May 17th to August 25th at Victoria Community Pasture was 29.94 kg/DM per ha.
Table 1: Monthly changes in pasture DM%, pasture density and pasture growth rates
| Pasture DM (%) | Pasture Density (Kgs DM Ha cm) | Pasture Growth Rates (Kgs DM per Ha per Day) | |
| May | 31 | 178.51 | 68.41 |
| June | 37 | 154.66 | 29.46 |
| July | 31 | 191.93 | 23.67 |
| August | 36 | 272.29 | 36.84 |
As expected, pasture density fluctuated throughout the sampling period at Victoria Community Pasture. This is in line with observations from other Ontario locations that pasture density in Ontario is very farm specific. As an example, the secondary project location in Nestleton had a density figure of 228.03 (kg DM per ha cm) in May which was higher in comparison to the density determined at Victoria Community Pasture for the same month (178.51kg DM per ha cm).
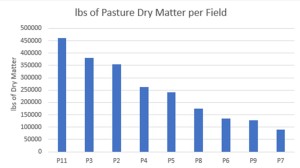
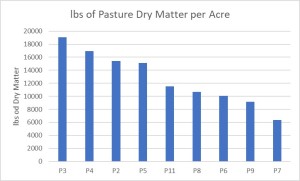
The pasture dry matter content stayed relatively consistent throughout the grazing season. The total lbs of pasture dry matter produced throughout the grazing season are displayed in the graphs below (Figures 4 and 5). Pastures on the South end of the property (i.e., P2, P3, P4, and P11) produced a greater abundance of pasture dry matter in comparison to pastures on the North end (i.e., P7, P8, P9). When comparing the lbs of pasture dry matter produced per acre, P3 was the most productive, and P7 was the least productive.
The ability to determine which sections of the farm as performing better than other sections allows producers the capacity to target specific areas of the farm for improvements.
Conclusions
A rising plate meter is a very fast, easy and effective tool as it allows the easy estimation of pasture dry matter content without the need to collect and dry a large number of pasture samples, although initially, some pasture sampling is required to calculate pasture density. Knowledge of pasture dry matter content at any given time allows improved pasture management through better grazing decisions. Better grazing decisions enables more efficient use of available pasture, improved livestock performance and ultimately, improved farm profitability through increased output and reduced costs per unit area.
This article is the first in a series of articles that will outline the results from the OMAFRA Summer pasture project on the use of a rising plate meters as a tool for pasture management and the benefits to producers.
References
Byrne, J. and Van Camp, M. 2019. Calculation of pasture utilization rates by beef cattle grazing two Ontario Community Pastures, (unpublished), Ontario Ministry of Agriculture.
Kyle, J., Grazing Specialist/OMAFRA, 2013, Budgeting and Measuring Pasture Production, Crop Talk, http://www.omafra.gov.on.ca/english/crops/field/news/croptalk/2010/ct-0910a7.htm
Kyle, J., Grazing Specialist/OMAFRA, 2013, Pasture Records, Organic News, http://www.omafra.gov.on.ca/english/crops/organic/news/2013/2013-08a2.htm
McCarthy, B., Pierce, K.M., Delaby, L., Brennan, A., Fleming, C. and Horan, B., 2012, Effect of stocking rate and calving date on grass production, Grass and Forage Science 68, 364-377, https://doi.org/10.1111/j.1365-2494.2012.00904.x
Menegotto, M., Student, OMAFRA and O’Reilly, C., Forage and Grazing Specialist, OMAFRA, 2019, Know the Amount of Feed in Your Pasture: A Dry Matter Yield Estimation Tool, OMAFRA Virtual Beef, http://www.omafra.gov.on.ca/english/livestock/beef/news/vbn0919a2.htm
O’Donovan, M., Dillon, P., 1999. Measurement of Grassland Management Practice on Commercial Dairy Farms, End of Project Reports, URI: http://hdl.handle.net/11019/1433
OMAFRA. (2015). Pasture Production: Publication 19. Retrieved from, http://www.omafra.gov.on.ca/english/crops/pub19/Publication19.pdf
Statistics Canada. (2011). Snapshot of Canadian Agriculture Chapter 1. Retrieved from, https://www150.statcan.gc.ca/n1/pub/95-640-x/2011001/p1/p1-01-eng.htm