Conditions
For most of southern and central Ontario, this week’s rains were timely to support crop establishment. Precipitation June 7th ranged from 12 to 50 mm (1 to 2 inch), with regional reports in southern Ontario (Lambton, Middlesex, Bruce and Grey counties) reporting over 50 to 55 mm (2 to 2.3 inch).
Cereals
Herbicide applications are underway in spring cereals and reports indicate these crops are looking good across the province, including the northeast. Seeding deadlines were extended until June 5th in Northwestern Ontario to support producers dealing with record-breaking rainfall. However, continued wet conditions meant that most seeding of cereals had not been completed by June 5th.
Cereal leaf beetle is not being observed in high numbers yet this season, even in areas where pressure has been high in recent years. Little to no disease has been reported to date in winter wheat, aside from some cases of powdery mildew that has been linked to susceptible varieties. Fungicide applications for prevention of fusarium head blight are either complete or planned for this week when the weather cooperates. Some producers have reported that they do not observe pollen on the heads, making it difficult to determine the ideal fungicide application stage. Wheat anthers may not extrude pollen but if heads are fully exposed the window for fungicide application is open, provided it has not entered the preharvest interval – check the fungicide label for the preharvest interval. Wheat planted in November is heading now.
Soybeans
The spring has been relatively normal in terms of soybean seeding and progress. While unplanted fields have been noted in some areas, soybean growth stages range from emerging to 2nd trifoliate stage. Populations look low in some fields, and this may be because of poorer performance of drills on heavier soils compared to row unit planters. Some no-till fields look thin and a few replants have occurred. Soybeans can perform well with thinner stands, and it is commonly reported that no-till soybeans look tough early in the season but yield similar to tilled fields. Cool nighttime temperatures and crusted soil may contribute to slow or reduced emergence. Rolling before rain can increase the risk of crusting. Rolling at V1 (first trifoliate) during the heat of the day with a smooth roller is recommended and does not significantly damage plants or reduce stands compared to other timings.
Some wireworm and seedcorn maggot have been observed but overall reports of these pests are low. Bean leaf beetle have been noted in early emerging soybean fields, and typically these fields are second year soybeans or adjacent to alfalfa fields. During soybean seedling stages (VC-V2) the threshold is 16 adult beetles per 30 cm of row, although control is also warranted if they are clipping stems. Black cutworm has also been reported in some soybean fields which is uncommon, and there is no specific threshold established. Monitor the level of stem clipping and plant populations and consider controlling cutworm where stands are being affected, the larva are still small (under 2.5 cm) and seed for replanting is not available. Bt traits should control cutworm, but ingestion of the toxin requires they feed on a plant and therefore clip off a stem. Within two weeks they should no longer be an issue.
Corn
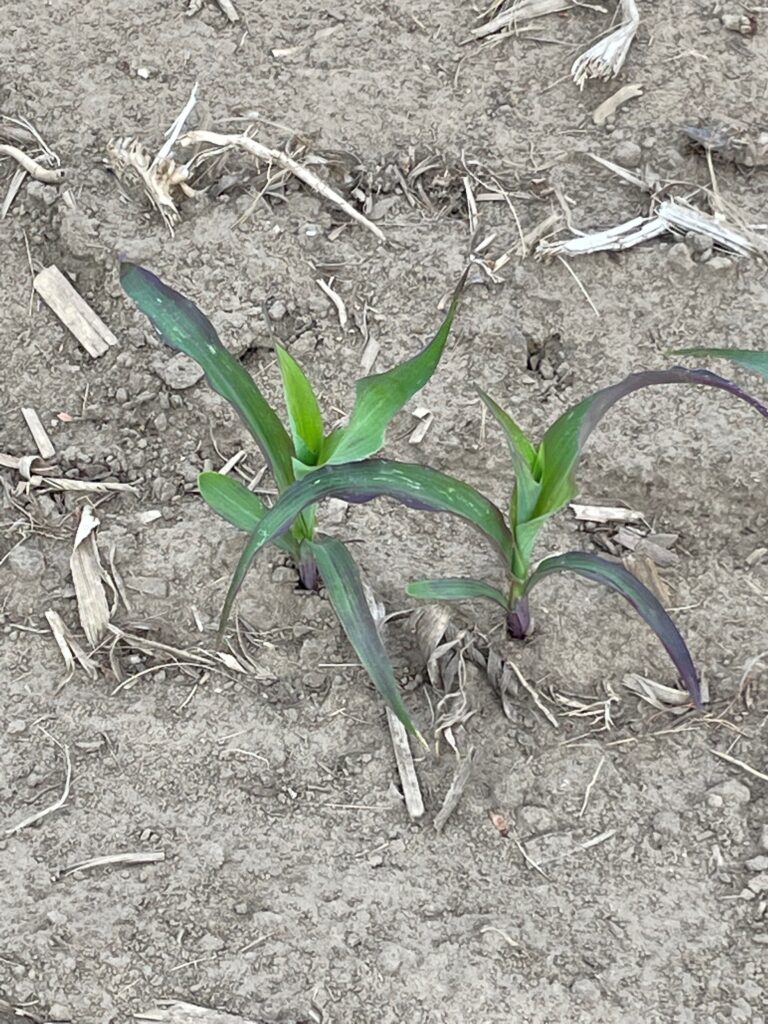
Corn growth progress looks good and stands are generally healthy. Growth stages range from V2 to V5. Some producers have noted purpling of leaves on corn seedlings (Figure 1.). In many cases this is related to genetics and is not a major concern. Where it is related to genetics, purpling may be present on the first 4 to 5 leaves and occurs after a few bright, sunny days followed by cool nights. It is a result of anthocyanin pigment formation. With warm weather the corn will outgrow this quickly, but the purpling may remain if growth is slow due to cool temperatures. If purpling is uneven across the field and continues beyond the 6-leaf stage, there may be a phosphorous deficiency. Deficiency will be most visible on the oldest leaves and may result in stunted growth. Soil tests will aid in diagnosing phosphorous deficiency.
Dry Beans
Dry bean planting is ongoing, and soil conditions have been good. Adzuki beans, which are often planted earlier than other market classes, have emerged in many fields. Some white and black beans have emerged, but most bean fields were planted within the past week. Cranberry beans are typically planted last because they mature faster than other beans. Early June is the ideal planting window, when soil conditions and temperatures allow, but planting will continue to mid-month. Later plantings often result in issues with late harvest. It is expected that acreage of dry bean in Ontario will be lower this year than in the past 5 years.
Forages
First cut forages were harvested in the past week. Grasses were ahead of alfalfa for maturity. Yields in the southwest were disappointing in some fields where there was more winter damage than first expected. Some fields were repurposed to silage corn or soybeans depending on feed inventories. Alfalfa weevils are present in many fields. Growers are taking advantage of good weather conditions to apply manure to harvested forage fields.
Weather Data – May 30 – June 5, 2022
| Location | Year | Highest Temp (°C) | Lowest Temp (°C) | Rain (mm) | Rain (mm) April 1st | GDD 0C April 1st | GDD 5C April 1st | CHU May 1st |
| Harrow | 2022 | 31.1 | 8.6 | 2.7 | 156 | 792 | 495 | 679 |
| 2021 | 28.8 | 4.6 | 21.6 | 124 | 799 | 487 | 574 | |
| 10 YR Avg. (2011-20) | 25.2 | 11.8 | 14.9 | 203 | 786 | 458 | 650 | |
| Ridgetown | 2022 | 31.5 | 4.9 | 2.8 | 128 | 737 | 447 | 617 |
| 2021 | 28.5 | 1.2 | 18.2 | 115 | 740 | 437 | 546 | |
| 10 YR Avg. (2011-20) | 25.3 | 10.2 | 15.5 | 179 | 726 | 404 | 597 | |
| London | 2022 | 30.0 | 5.9 | 10.3 | 151 | 717 | 432 | 596 |
| 2021 | 29.3 | 3.8 | 14.0 | 119 | 740 | 441 | 523 | |
| 10 YR Avg. (2011-20) | 24.6 | 9.9 | 21.0 | 189 | 712 | 393 | 589 | |
| Brantford | 2022 | 31.1 | 3.6 | 5.0 | 129 | 711 | 420 | 568 |
| 2021 | 30.9 | 2.8 | 14.7 | 115 | 715 | 415 | 512 | |
| Welland | 2022 | 29.1 | 7.3 | 26.6 | 145 | 755 | 454 | 610 |
| 2021 | 26.9 | 3.2 | 10.5 | 82 | 714 | 411 | 500 | |
| 10 YR Avg. (2011-20) | 25.0 | 9.7 | 19.6 | 195 | 713 | 394 | 584 | |
| Elora | 2022 | 29.8 | 4.4 | 4.7 | 125 | 654 | 376 | 524 |
| 2021 | 29.4 | 2.8 | 9.6 | 94 | 646 | 356 | 450 | |
| 10 YR Avg. (2011-20) | 23.6 | 8.0 | 22.3 | 188 | 615 | 310 | 500 | |
| Mount Forest | 2022 | 30.2 | 4.5 | 2.9 | 132 | 664 | 392 | 552 |
| 2021 | 28.6 | 0.9 | 7.3 | 98 | 654 | 367 | 457 | |
| 10 YR Avg. (2011-20) | 22.7 | 8.3 | 18.0 | 171 | 601 | 303 | 494 | |
| Peterborough | 2022 | 30.9 | 3.5 | 14.1 | 118 | 661 | 368 | 546 |
| 2021 | 30.6 | -1.5 | 8.9 | 90 | 643 | 341 | 454 | |
| 10 YR Avg. (2011-20) | 24.7 | 7.4 | 25.5 | 175 | 630 | 323 | 517 | |
| Kemptville | 2022 | 28.4 | 6.6 | 18.8 | 242 | 726 | 414 | 597 |
| 2021 | 27.8 | 0.5 | 19.0 | 98 | 740 | 433 | 518 | |
| 10 YR Avg. (2011-20) | 25.6 | 8.5 | 19.9 | 179 | 659 | 354 | 545 | |
| Earlton | 2022 | 30.4 | 5.4 | 2.3 | 113 | 557 | 313 | 515 |
| 2021 | 26.6 | -0.9 | 14.7 | 78 | 613 | 331 | 437 | |
| 10 YR Avg. (2011-20) | 20.2 | 5.1 | 21.0 | 147 | 440 | 218 | 399 | |
| Sudbury | 2022 | 26.8 | 6.2 | 3.7 | 138 | 557 | 305 | 489 |
| 2021 | 27.6 | 2.4 | 0.9 | 97 | 608 | 328 | 429 | |
| 10 YR Avg. (2011-20) | 20.5 | 6.0 | 23.4 | 172 | 490 | 246 | 426 | |
| Thunder Bay | 2022 | 23.8 | 0.0 | 18.0 | 298 | 385 | 169 | 321 |
| 2021 | 29.3 | 0.0 | 4.9 | 155 | 493 | 226 | 377 | |
| 10 YR Avg. (2011-20) | 20.3 | 3.5 | 21.7 | 151 | 396 | 163 | 324 | |
| Fort Frances | 2022 | 25.6 | 1.1 | 51.4 | 298 | 417 | 203 | 378 |
| 2021 | 35.9 | 1.5 | 4.0 | 111 | 550 | 276 | 461 | |
| 10 YR Avg. (2011-20) | 22.1 | 5.6 | 23.3 | 132 | 470 | 219 | 406 |
2 thoughts on “Crop Report – June 8, 2022”
Comments are closed.