General
Field crops in general across Ontario are doing well and welcomed the rain of the past few days. The need for moisture is coming up as the corn begins rapid growth. Winter wheat looks good across the province although have been impacted by dry conditions in areas.
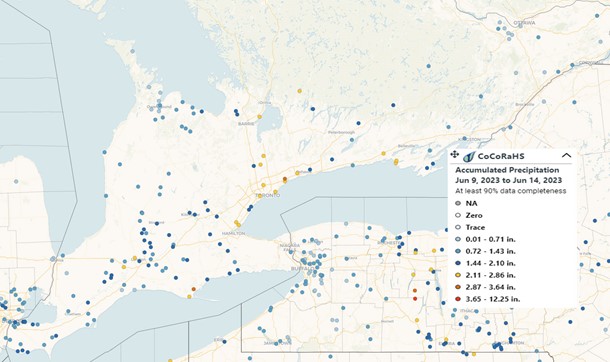
Rain across the province was welcomed but hail occurred in many areas with East Chatham-Kent through West Elgin reporting crop injury.

Figure 1. Rainfall amounts June 9-14, 2023, from CoCoRHAS (https://cocorahs.org/Canada.aspx)
The planting season went by extremely fast and under dry conditions. Farmers were concerned with soil moisture and planted as deep as needed to plant seed into moisture. This has resulted in good germination and reasonable emergence in most fields setting the crops up for excellent yield potential.
Corn
Corn is growing well and has not suffered much from the recent 3-4 dry weeks. Areas that planted on heavier soils or rushed ahead of the mid-May rains have seen some emergence problems. Corn is mostly in the 4-10 leaf stage and its speed of growth will increase greatly with the rains.

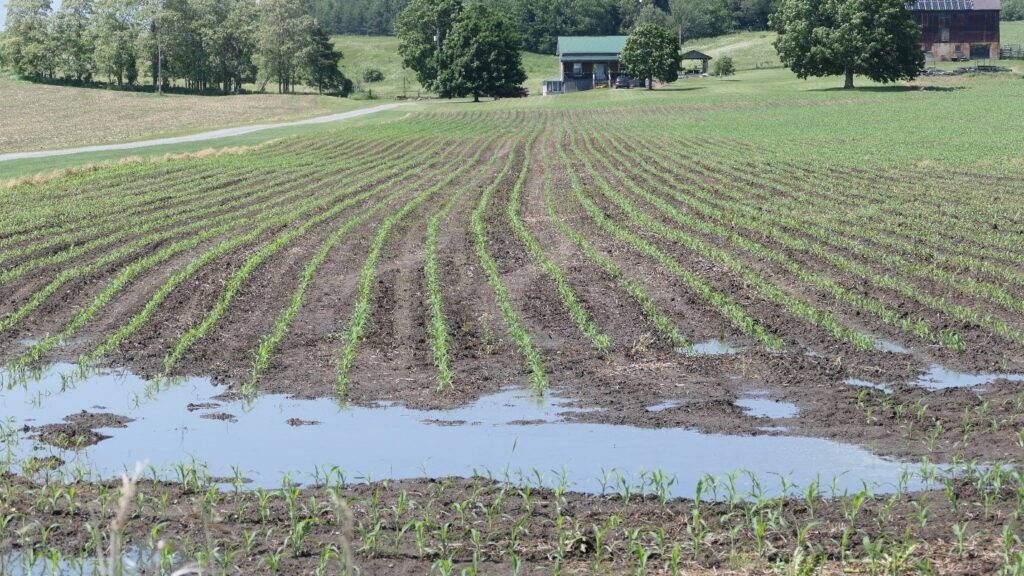
Figure 2. Pleased to see rainfall evidence in central Ontario corn field (OMAFRA)
Nitrogen side-dressing is just beginning to well under way for those that use this period to make final N rate adjustments. The cooler weather and lower precipitation this spring suggests that soil N supply may be slightly less than normal; see FieldCropNews.com article 2023’s anticipated soil nitrogen supply. However, adjusting total N rates for the crop should be made on a field-by-field basis considering yield potential, field history, soil type, current fertilizer N rates applied and weather. Based on the state of the crop and weather, normal to slightly higher side-dress N rates may be needed.
Much of the corn crop was sprayed with pre-emergence herbicide programs after the rains in mid-May. Even those who applied herbicides before mid-May rains might not have had enough to activate the herbicides. Pre-emergence herbicides need to be taken up through shoots and/or roots from soil water. If the herbicide did not receive enough rainfall the weeds will have grown through the herbicide layer. For most areas the current rains will be enough to activate but this will not control the weeds that are already growing. Regardless it is a weed year and farmers are encouraged to scout fields and make timely decisions on sprays and resprays of corn fields. Weeds and the crop will quickly grow past optimum crop and weed growth stages making control more difficult.
Fields of corn-on-corn with a history of CRW Bt hybrid use should be scouted for corn rootworm resistance and report unexpected damage. To determine if resistant populations are developing in your fields monitor adult populations using sticky traps. Fields catching 2 or more beetles per trap per day indicate potential resistance. Monitoring traps weekly in the fields in July and August also enables early detection of crop injury including goosenecking and lodging so that harvest plans can be adjusted, and crop rotation can be considered the next year. Anyone interested in trapping for corn rootworm can join the Corn Rootworm Trap Network and get free traps (thanks to ABSTC and GFO) from Tracey Baute, OMAFRA.
Soybeans
Much of the soybean crop is doing well. There continues to be emergence of plants in some fields where planting depth and date were issues. Recent rains may spur on some of those plants that have been sitting as ungerminated seed in dry soil. Some replants have occurred on heavy textured soils and/or following the cool wet period of May 17-21. Crop advisors are pleased with the root systems developing in many of these soybean fields.
Weed control is the primary concern of soybeans. Depending on when pre-emergence herbicide treatments were applied, activation may not have or will occur. Weed escapes are expected and farmers need to be scouting to ensure timely weed control. Weeds emerged in the dry conditions will be hardy and will begin rapid growth with the recent rains.
Winter Wheat
Wheat for the most part still looks excellent. There are places on dry knolls or sandy soils where it’s obvious there has been some yield potential lost.
The crop ranges in maturity by location. In the far southwest it’s well into grain fill whereas moving east heading started mid- to late last week. T3 fungicides were starting and have been interrupted by the recent rains. With the dry conditions prior to this past weekend some elected to skip a T3. Others are still planning to apply if they can get to before the end of flowering.
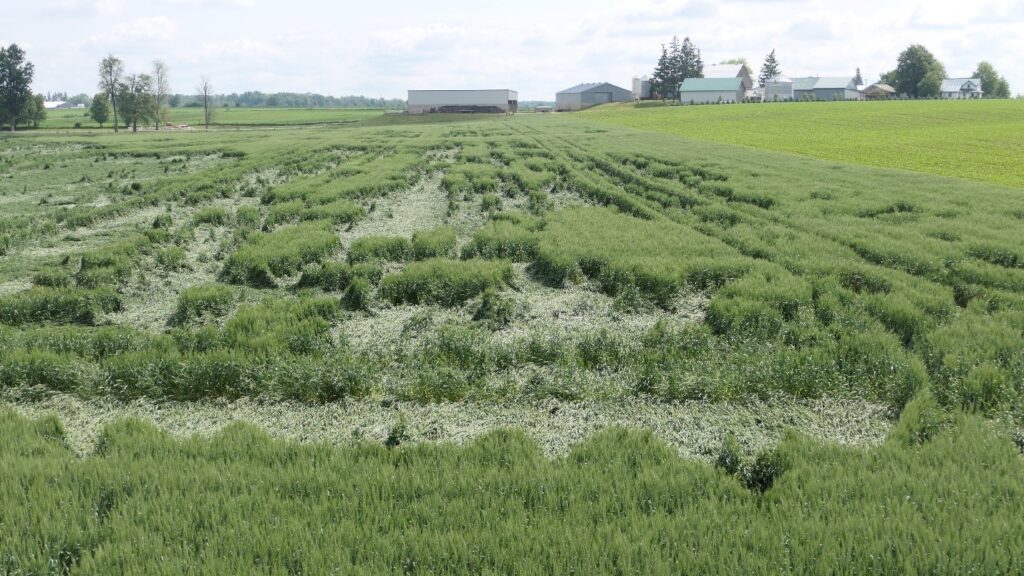
In general yield potential looks excellent. It will be interesting to see whether the cool temperatures in mid-May with a couple of frosty nights may have impacted some wheat depending on what stage it was at. Recent rains may be showing the value of PGR’s so have a look at fields to rate the value of such treatments. A few fields have lodged from recent rains, but still minor.

Figure 3. Evident but not common winter wheat lodging from recent rain (OMAFRA)
Forages
Much of the dairy first cut has been harvested. Reports indicate yields about 2/3rds of normal due to cool spring nights and an early harvest window. The recent rain will spur rapid regrowth and set up for a good second cut. Alfalfa weevil populations passed threshold in parts of southwestern Ontario. Cutting early is still the best control measure for this pest.
The risk of spontaneous combustion in dry hay harvested during late May remains high due to incomplete drying. More details can be found in last week’s crop report, and information to prevent and extinguish hay fires in available on Field Crop News.
Some first cut hay that is yet to be harvested lodged from the recent rains, which may make harvest difficult.
Dry Beans
Most of the crop is planted, although some just recently as people chose to wait for rainfall. Weed control and scouting for weeds will be the priority in the coming days. Conditions for planting were excellent although dry for those who planted at the beginning of the month. Reminder that potato leaf hopper (PLH) is also a pest of dry beans. Scout fields for characteristic “hopperburn” on vulnerable new seedlings and young regrowth. Although high population levels haven’t been reported yet, recent storm fronts and hot dry conditions may have made it more favourable for this pest.
Weather Data
| Location | Year | Highest Temp (°C) | Lowest Temp (°C) | Rain (mm) | Rain (mm) April 1st | GDD 0C April 1st | GDD 5C April 1st | CHU May 1st |
| Harrow | 2023 | 26.2 | 7.6 | 16.6 | 93 | 910 | 561 | 700 |
| | 2022 | 26.2 | 11.4 | 33.1 | 189 | 902 | 575 | 816 |
| | 10 YR Avg. (2011-20) | 25.9 | 12.1 | 11.2 | 212 | 903 | 545 | 796 |
| Ridgetown | 2023 | 27.2 | 3.7 | 13.2 | 140 | 859 | 518 | 647 |
| | 2022 | 25.7 | 9.3 | 42.1 | 170 | 839 | 519 | 740 |
| | 10 YR Avg. (2011-20) | 25.6 | 11.0 | 10.7 | 187 | 836 | 484 | 731 |
| London | 2023 | 27.0 | 8.1 | 17.4 | 180 | 863 | 523 | 662 |
| | 2022 | 24.3 | 8.1 | 29.1 | 180 | 810 | 499 | 711 |
| | 10 YR Avg. (2011-20) | 25.2 | 10.3 | 19.6 | 206 | 819 | 471 | 720 |
| Brantford | 2023 | 27.1 | 7.5 | 13.8 | 153 | 842 | 501 | 638 |
| | 2022 | 25.0 | 6.0 | 28.6 | 158 | 809 | 488 | 684 |
| Welland | 2023 | 24.5 | 7.2 | 11.4 | 144 | 838 | 492 | 615 |
| | 2022 | 26.2 | 7.3 | 38.4 | 184 | 857 | 527 | 735 |
| | 10 YR Avg. (2011-20) | 25.0 | 9.8 | 19.9 | 213 | 819 | 470 | 713 |
| Elora | 2023 | 25.7 | 6.3 | 14.6 | 133 | 764 | 440 | 574 |
| | 2022 | 23.9 | 5.7 | 40.7 | 163 | 746 | 437 | 630 |
| | 10 YR Avg. (2011-20) | 24.0 | 8.7 | 21.7 | 206 | 715 | 379 | 618 |
| Mount Forest | 2023 | 25.0 | 4.1 | 7.4 | 153 | 763 | 444 | 577 |
| | 2022 | 23.7 | 7.9 | 44.5 | 176 | 754 | 452 | 656 |
| | 10 YR Avg. (2011-20) | 24.2 | 8.7 | 20.9 | 189 | 700 | 372 | 612 |
| Peterborough | 2023 | 24.1 | 4.8 | 5.6 | 147 | 765 | 429 | 552 |
| | 2022 | 23.0 | 3.5 | 68.7 | 186 | 757 | 434 | 659 |
| | 10 YR Avg. (2011-20) | 24.7 | 7.8 | 25.6 | 197 | 728 | 392 | 632 |
| Kemptville | 2023 | 23.7 | 6.9 | 1.1 | 203 | 800 | 469 | 577 |
| | 2022 | 24.0 | 6.6 | 31.1 | 270 | 827 | 485 | 720 |
| | 10 YR Avg. (2011-20) | 24.9 | 9.3 | 25.5 | 198 | 762 | 427 | 669 |
| Earlton | 2023 | 23.7 | 5.2 | 10.6 | 170 | 654 | 370 | 546 |
| | 2022 | 23.7 | 5.4 | 26.6 | 140 | 646 | 372 | 617 |
| | 10 YR Avg. (2011-20) | 23.4 | 6.2 | 15.8 | 160 | 528 | 276 | 498 |
| Sudbury | 2023 | 26.0 | 6.1 | 17.0 | 215 | 665 | 382 | 537 |
| | 2022 | 23.1 | 6.2 | 44.3 | 183 | 644 | 361 | 587 |
| | 10 YR Avg. (2011-20) | 23.2 | 8.0 | 13.3 | 183 | 586 | 312 | 539 |
| Thunder Bay | 2023 | 28.2 | 1.3 | 1.3 | 130 | 552 | 290 | 479 |
| | 2022 | 25.1 | -0.3 | 4.3 | 302 | 470 | 224 | 414 |
| | 10 YR Avg. (2011-20) | 22.3 | 5.2 | 12.5 | 162 | 477 | 214 | 412 |
| Fort Frances | 2023 | 26.5 | 1.7 | 2.4 | 113 | 710 | 441 | 686 |
| | 2022 | 24.1 | 1.1 | 0.0 | 298 | 499 | 255 | 471 |
| | 10 YR Avg. (2011-20) | 24.0 | 7.2 | 22.8 | 154 | 562 | 280 | 511 |