Crop Report – Week of July 17th, 2023
As winter wheat harvest continues, persistent rainfall events are delaying harvest in some regions. While yields have been promising thus far; wheat quality has been a concern for some as harvest delays continue.
Black Point
As wheat matures and tissue begins to die, fields have turned black from Alternaria species. This is particularly prevalent in those fields that did not receive a T3 fungicide with active ingredients effective on Alternaria; fields that experienced dry conditions earlier in the season and have been prone to premature seed senescence; and lodged fields. These fields should be the first harvested as this pathogen can cause black point and lower grain quality.
While black point does not have a negative impact on yield, it causes kernels to develop a black, smudge-like discolouration usually on the embryo (germ) end (Figure 1). This discolouration then results in wheat being downgraded because the black point infected kernels will cause the flour to turn grey during the milling process, making it undesirable to end users. Black point is particularly challenging during wet, warm weather during the grain fill period. It does not produce spores and will continue to grow on living tissue. Timely harvest is the most effective management strategy for reducing its progression.
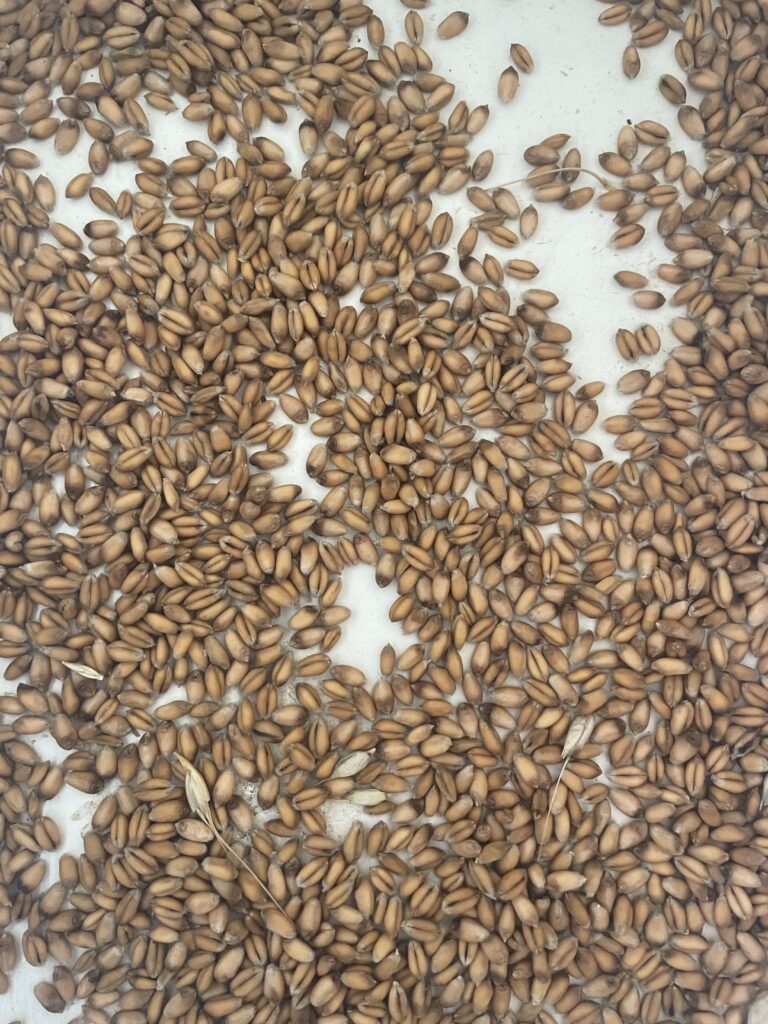
Figure 1: Winter wheat kernels that have developed a black, smudge-like discolouration on the embryo (germ) end known as black point.
Sprouting Management
Pre-harvest sprouting has also been a concern as persistent rainfall events continue. Pre-harvest sprouting can result in downgraded wheat at the elevator due to a low falling number. Pre-harvest sprouting can be initiated by cool, rainy conditions once wheat has reached physiological maturity. When there are multiple rainy days in a row, there is an even greater risk for sprouting, even for varieties with good sprouting resistance. Previous Ontario research showed that when harvest was delayed by two weeks the amount of sprouted wheat increased by almost 10% and yield was reduced by almost 4 bushels/acre (Table 1). In 2021, many areas received persistent rainfall once wheat reached physiological maturity, resulting in increased sprouts and low falling numbers across the province.
| Harvest Date | Yield (bu/ac) | Test Weight (lb/bu) | Sprouts (%) |
| July 13 | 92.4 | 62.0 | 0.0 |
| July 18 | 91.8 | 61.3 | 0.0 |
| July 21 | 91.7 | 60.4 | 2.3 |
| August 1 | 88.7 | 57.8 | 8.8 |
Low falling numbers can also be caused by late maturity alpha-amylase (LMA) production. LMA production is triggered by cold or heat shock during the later stages of maturity (26 to 30 days after pollen shedding). However, the specific temperature swing needed to induce LMA is not yet clear. Hard red wheat is generally more tolerant to pre-harvest sprouts while soft white wheat is extremely vulnerable.
Wheat is considered sound and satisfactory for most milling and baking processes with a falling number of about 300 seconds; however, levels as low as 250 can be acceptable to end users. While growers are given a grade based on sprouts, mills are increasingly looking at falling numbers as an indicator of wheat quality. As a result, growers are encouraged to review all contracts to ensure they are aware of falling number or any other quality requirements upon delivery of grain.
The best defense against sprouting and low falling numbers is to harvest wheat as quickly as possible once it reaches maturity. Harvesting early and drying your grain can be an effective means of avoiding sprouting. Selecting pre-harvest sprouting resistant wheat varieties can also help reduce risks. Avoid mixing wheat with low and high falling numbers. This will not result in a better falling number. Sprouted wheat or wheat with a low falling number should be kept separate from sound wheat. If storing wheat on-farm for later shipment, consider submitting a grain sample to a wheat testing lab for falling number analysis.
Production Insurance may compensate affected winter wheat growers by applying a quality factor to low-grade wheat yields to reflect the lower prices received for these crops. The following link shows an example of how the coverage works. Production Insurance customers who experience winter wheat quality downgrades should contact Agricorp.
Customers can report yields by phone, fax, mail or email by September 1, 2023. The sooner yields are reported, the sooner any claims can be paid.
Website: Agricorp.com; Telephone (Mon. to Fri., 8:00 a.m. to 4:30 p.m.), 1-888-247-4999, TTY: 1-877-275-1380 or Email contact@agricorp.com
Pre-Harvest Sprouting in the 2021 Winter Wheat Crop – Field Crop News
Weather Data – July 10 – 16, 2023
| Location | Year | Highest Temp (°C) | Lowest Temp (°C) | Rain (mm) | Rain (mm) April 1st | GDD 0C April 1st | GDD 5C April 1st | CHU May 1st |
| Harrow | 2023 | 28.6 | 15.5 | 30.0 | 274 | 1631 | 1107 | 1604 |
| 2022 | 29.8 | 12.8 | 59.9 | 280 | 1690 | 1183 | 1771 | |
| 10 YR Norm (11 – 20) | 29.2 | 18.4 | 16.0 | 349 | 1805 | 1243 | 1921 | |
| Ridgetown | 2023 | 28.0 | 12.1 | 20.1 | 348 | 1548 | 1032 | 1492 |
| | 2022 | 29.3 | 9.6 | 22.6 | 204 | 1576 | 1076 | 1613 |
| | 10 YR Avg. (2011-20) | 29.0 | 16.7 | 16.6 | 296 | 1697 | 1139 | 1789 |
| London | 2023 | 27.9 | 12.4 | 29.4 | 326 | 1539 | 1024 | 1486 |
| | 2022 | 29.2 | 9.7 | 5.5 | 203 | 1530 | 1040 | 1564 |
| | 10 YR Avg. (2011-20) | 29.2 | 16.2 | 21.5 | 320 | 1673 | 1119 | 1766 |
| Brantford | 2023 | 27.7 | 12.5 | 15.5 | 286 | 1531 | 1015 | 1482 |
| | 2022 | 30.2 | 8.4 | 14.3 | 201 | 1532 | 1031 | 1520 |
| Welland | 2023 | 27.4 | 14.1 | 23.1 | 286 | 1543 | 1022 | 1485 |
| | 2022 | 29.8 | 11.6 | 11.9 | 205 | 1581 | 1071 | 1615 |
| | 10 YR Avg. (2011-20) | 28.7 | 16.6 | 11.1 | 300 | 1678 | 1123 | 1774 |
| Elora | 2023 | 26.6 | 10.0 | 51.0 | 270 | 1411 | 912 | 1357 |
| | 2022 | 28.4 | 7.1 | 1.6 | 179 | 1399 | 910 | 1390 |
| | 10 YR Avg. (2011-20) | 27.8 | 13.6 | 15.9 | 316 | 1501 | 960 | 1572 |
| Mount Forest | 2023 | 26.0 | 10.3 | 39.1 | 292 | 1407 | 913 | 1355 |
| | 2022 | 28.4 | 8.8 | 12.2 | 207 | 1399 | 918 | 1414 |
| | 10 YR Avg. (2011-20) | 27.1 | 13.9 | 19.1 | 314 | 1482 | 949 | 1568 |
| Peterborough | 2023 | 29.2 | 9.5 | 59.4 | 265 | 1437 | 926 | 1351 |
| | 2022 | 29.1 | 9.2 | 9.4 | 228 | 1414 | 911 | 1428 |
| | 10 YR Avg. (2011-20) | 28.6 | 12.8 | 12.5 | 277 | 1522 | 980 | 1576 |
| Kemptville | 2023 | 31.0 | 13.2 | 55.3 | 301 | 1538 | 1032 | 1466 |
| | 2022 | 30.6 | 11.1 | 32.5 | 347 | 1516 | 993 | 1542 |
| | 10 YR Avg. (2011-20) | 29.0 | 14.8 | 12.6 | 303 | 1597 | 1057 | 1677 |
| Earlton | 2023 | 27.9 | 9.7 | 5.2 | 242 | 1306 | 847 | 1302 |
| | 2022 | 29.8 | 7.1 | 8.5 | 209 | 1257 | 803 | 1321 |
| | 10 YR Avg. (2011-20) | 26.7 | 11.7 | 18.1 | 261 | 1262 | 805 | 1374 |
| Sudbury | 2023 | 27.1 | 9.8 | 14.9 | 369 | 1320 | 861 | 1313 |
| | 2022 | 27.5 | 9.8 | 3.0 | 211 | 1259 | 796 | 1321 |
| | 10 YR Avg. (2011-20) | 27.3 | 13.0 | 6.9 | 286 | 1355 | 876 | 1470 |
| Thunder Bay | 2023 | 26.3 | 6.0 | 4.3 | 184 | 1137 | 700 | 1158 |
| | 2022 | 27.9 | 5.7 | 5.5 | 364 | 1046 | 620 | 1056 |
| | 10 YR Avg. (2011-20) | 26.3 | 11.5 | 18.7 | 293 | 1177 | 708 | 1236 |
| Fort Frances | 2023 | 25.7 | 6.0 | 4.2 | 194 | 1299 | 855 | 1357 |
| | 2022 | 30.8 | 11.0 | 32.1 | 475 | 1128 | 704 | 1203 |
| | 10 YR Avg. (2011-20) | 27.3 | 11.1 | 20.0 | 286 | 1303 | 816 | 1395 |