Managing Cover Crop Nitrogen / Residue Breakdown
Across Ontario, wheat harvest continues, opening the best window for planting cover crops in most field crop rotations. You can find more information on the 2023 winter wheat quality update and achieving success with cover crops after wheat at fieldcropnews.com. But can those cover crops be managed to supply nitrogen to the next crop?
The amount of nitrogen a cover crop could supply to the following corn crop is a factor of the total amount of nitrogen it contains and how much of that will be released in time for the corn to take it up.
Cover Crop Nitrogen
The amount of nitrogen in a cover crop stand is determined by the amount of biomass (crop residue, roots) and its nitrogen (N) concentration. More cover crop biomass usually means more N. Planting early, using winter-hardy cover crop species that continue growing in the spring, and delaying termination can all increase biomass and total cover crop N.
The highest amount of nitrogen usually comes from a good stand of pure legumes. Most legumes are 3-4% N, and a good stand can easily contain over 150 lb N per acre.
But all cover crop species will accumulate nitrogen from the soil in their biomass. Scavenging nitrogen left over from fertilizer is a primary cover cropping goals in some situations. Even legumes, which we typically think of as fixing their own N, will first take up residual mineral N before doing much fixation. When that N is held in organic form in biomass, it is safer from loss to the environment, but it then needs to be released to be available for the following crop, ideally when the crop has high N demand.
Cover Crop Nitrogen Availability and Release
Accumulated N in cover crop biomass is released after decomposition and mineralisation. The rate and timing of N availability depends on the carbon to nitrogen ratio (C:N) of the biomass, soil texture, moisture, and temperature.
The soil microbes that decompose cover crop residue need carbon and nitrogen in a certain balance. A C:N ratio around 24:1 has the balance of carbon and nitrogen that microbes need to decompose residue efficiently. With higher C:N residues, microbes take the extra N they need from the soil, which can lead to competition with corn N uptake. The microbial N is eventually released, but too little too late for corn. If the C:N ratio is much lower, N is released quickly, sometimes before the crop can use it.
Cover crop species vary in their C:N. Legumes and brassicas have lower C:N ratios than cereals and grasses. This provides the opportunity to manage cover crop C:N by mixing species. An experiment in Maryland, US that mixed cereal rye and hairy vetch in six different proportions, a 50:50 split between rye and vetch biomass was able to achieve a C:N ratio between 25 and 30. (The pure cereal rye had a C:N of 86, while the C:N of pure hairy vetch was 16). Predicting biomass proportions from relative seeding rates is tricky and depends on timing, weather, and soil N availability. The C:N ratio of established cover crop mixes can be measured by lab analysis of biomass samples collected around cover crop termination time. Harvest from a measured square area to be able to convert results to a per-acre basis (Figure 1).

Figure 1. Cover crop biomass harvested from a 0.25m2 area for tissue analysis.
The composition of cover crop biomass carbon also matters. Carbon in biomass is a mix of carbohydrates (sugars), cellulose, and lignin. As cover crops mature, C:N tends to increase, as does the proportion of cellulose and lignin, which are harder for microbes to break down. This is especially true for cereals as they mature. This starts at tillering and accelerates after stem elongation. Finally, tillage can speed up residue decomposition and nitrogen release. Residue sizing, increased soil contact, and soil aeration from tillage cause a quick rise in residue decomposition rate and can produce a flush of nitrogen release, whereas residue left on the surface breaks down and releases nitrogen gradually over the season (Figure 2).
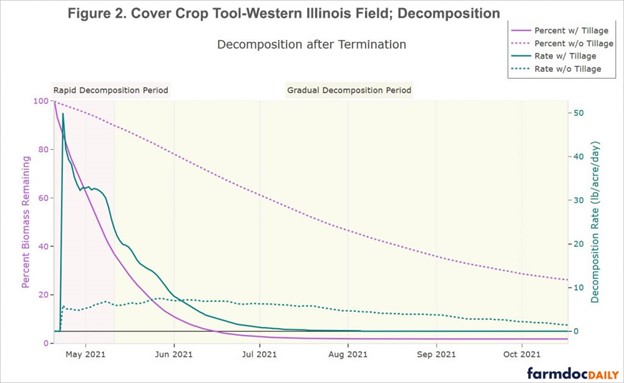
Figure 2. Cover crop residue decomposition peaks quickly after tillage and is more gradual in no-till scenarios (as modeled by the University of Illinois Cover Crop Decision Support Tool based on trial data). Figure from https://farmdocdaily.illinois.edu/2021/02/introducing-an-update-to-the-cover-crop-decision-support-tool.html.
Predictive Tools for Nitrogen Release
Accurately predicting the amount and timing of nitrogen release from cover crops is challenging. Several tools have been released in the last few years that build on decades of research to help manage that challenge.
The University of Illinois and Purdue University produced a tool to guide cover crop termination timing by showing how cover crop C:N changes in the spring and how that timing influences decomposition rates under different weather scenarios.
Penn State created a tool for adjusting corn N rates based on cover crop biomass N content and C:N ratio that also considers soil texture and organic matter. This is a good tool to see how much cover crop biomass is needed for a large N credit.
A tool developed from the USDA’s, Natural Resources Conservation Service (NRCS) research, available from the Northeast Cover Crop Council includes lab-analyzed N, carbohydrates, cellulose, and lignin to estimate the amount and timing of nitrogen released from cover crop residues (Figure 3).
Note of caution: These tools have not been tested or calibrated in Ontario and should not be used for direct N credit recommendations, but rather may show trends of cover crop N release to help with on-farm trials and decision making on your farm.
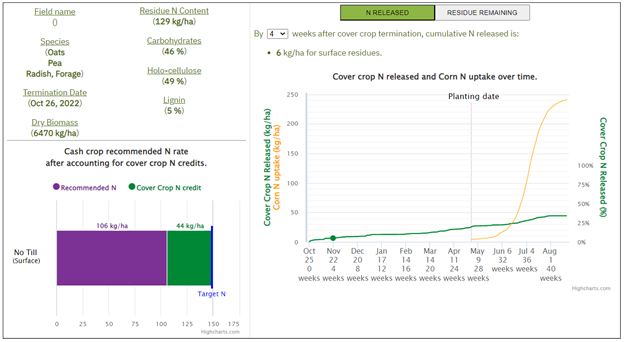
Figure 3. Outputs from the Cover Crop Nitrogen Calculator showing the nitrogen credit and approximate release timing from a hypothetical cover crop.
Take-home Messages
- Experiment on your own fields to see how your cover crops affect optimum nitrogen rates.
- For a sense of what to expect from a cover crop mix, send a sample for lab testing of the C:N ratio at cover crop termination.
- Most cover crops grown in Ontario don’t provide a significant N credit next season, but consistent cover cropping can build soil organic nitrogen pools and increase soil N supplying potential over time.
Weather Data – July 24 – 30, 2023
| Location | Year | Highest Temp (°C) | Lowest Temp (°C) | Rain (mm) | Rain (mm) April 1st | GDD 0C April 1st | GDD 5C April 1st | CHU May 1st |
| Harrow | 2023 | 29.4 | 13.7 | 55.0 | 344 | 1937 | 1343 | 1985 |
| 2022 | 29.0 | 13.6 | 1.0 | 302 | 1993 | 1421 | 2147 | |
| 10 YR Norm (11 – 20) | 28.0 | 16.0 | 26.6 | 378 | 1983 | 1380 | 2141 | |
| Ridgetown | 2023 | 30.7 | 12.3 | 38.2 | 418 | 1841 | 1256 | 1850 |
| | 2022 | 29.9 | 12.8 | 2.4 | 211 | 1874 | 1310 | 1974 |
| | 10 YR Avg. (2011-20) | 27.4 | 13.8 | 34.8 | 335 | 1864 | 1267 | 1994 |
| London | 2023 | 29.8 | 13.0 | 72.4 | 410 | 1832 | 1247 | 1847 |
| | 2022 | 28.6 | 11.8 | 8.8 | 231 | 1817 | 1262 | 1912 |
| | 10 YR Avg. (2011-20) | 27.2 | 14.5 | 14.5 | 338 | 1842 | 1248 | 1975 |
| Brantford | 2023 | 29.6 | 12.3 | 61.2 | 356 | 1822 | 1236 | 1836 |
| | 2022 | 29.8 | 11.2 | 1.9 | 231 | 1822 | 1256 | 1866 |
| Welland | 2023 | 29.6 | 13.0 | 77.8 | 379 | 1842 | 1250 | 1858 |
| | 2022 | 28.6 | 12.0 | 15.8 | 264 | 1871 | 1295 | 1977 |
| | 10 YR Avg. (2011-20) | 27.3 | 15.0 | 18.8 | 321 | 1850 | 1255 | 1987 |
| Elora | 2023 | 29.1 | 10.7 | 27.2 | 335 | 1682 | 1113 | 1687 |
| | 2022 | 28.5 | 9.0 | 12.4 | 196 | 1664 | 1111 | 1706 |
| | 10 YR Avg. (2011-20) | 26.2 | 12.0 | 18.9 | 335 | 1657 | 1076 | 1762 |
| Mount Forest | 2023 | 28.6 | 11.8 | 28.9 | 326 | 1681 | 1117 | 1693 |
| | 2022 | 26.0 | 11.6 | 28.3 | 260 | 1664 | 1117 | 1740 |
| | 10 YR Avg. (2011-20) | 26.1 | 12.3 | 20.5 | 339 | 1637 | 1064 | 1759 |
| Peterborough | 2023 | 29.5 | 8.7 | 44.1 | 344 | 1710 | 1128 | 1675 |
| | 2022 | 27.8 | 10.6 | 7.4 | 262 | 1683 | 1115 | 1752 |
| | 10 YR Avg. (2011-20) | 28.4 | 12.1 | 19.0 | 297 | 1682 | 1101 | 1768 |
| Kemptville | 2023 | 29.2 | 9.1 | 56.0 | 371 | 1833 | 1257 | 1826 |
| | 2022 | 27.6 | 13.0 | 10.0 | 385 | 1802 | 1215 | 1896 |
| | 10 YR Avg. (2011-20) | 28.9 | 13.3 | 21.0 | 327 | 1764 | 1184 | 1881 |
| Earlton | 2023 | 27.4 | 8.3 | 13.3 | 266 | 1552 | 1023 | 1595 |
| | 2022 | 27.7 | 11.6 | 28.7 | 277 | 1515 | 997 | 1636 |
| | 10 YR Avg. (2011-20) | 26.4 | 10.3 | 14.7 | 281 | 1410 | 913 | 1553 |
| Sudbury | 2023 | 28.6 | 9.4 | 36.5 | 438 | 1578 | 1050 | 1626 |
| | 2022 | 26.2 | 13.0 | 13.1 | 257 | 1519 | 991 | 1643 |
| | 10 YR Avg. (2011-20) | 26.7 | 12.6 | 17.0 | 310 | 1512 | 993 | 1662 |
| Thunder Bay | 2023 | 31.4 | 8.2 | 12.8 | 212 | 1390 | 883 | 1456 |
| | 2022 | 28.7 | 8.9 | 11.0 | 398 | 1291 | 800 | 1345 |
| | 10 YR Avg. (2011-20) | 26.1 | 11.0 | 16.0 | 310 | 1325 | 816 | 1414 |
| Fort Frances | 2023 | 31.5 | 6.3 | 23.1 | 254 | 1550 | 1036 | 1655 |
| | 2022 | 28.6 | 8.3 | 15.3 | 521 | 1368 | 879 | 1490 |
| | 10 YR Avg. (2011-20) | 26.7 | 10.5 | 23.1 | 309 | 1451 | 925 | 1571 |
2 thoughts on “Crop Report – Week of July 31st, 2023”
Comments are closed.