Three tips for weed management this fall.
Reflecting on some of the weed control issues that came up this past spring, below are three key items where management activities this fall can significantly improve control and/or financial return next season.
1. Fall management provides better dandelion control.
In the fall, resource allocation of perennial weeds shifts and carbohydrates move towards the root system, building root mass for overwintering. When dandelions are managed in the fall, whether it be by tillage or herbicides, resource allocation to the roots is disrupted and control is significantly better when compared to management in the spring (Table 1). A better seed bed is also established when dandelions are managed in the fall since all the vegetative growth has been desiccated by planting time (Figure 1).
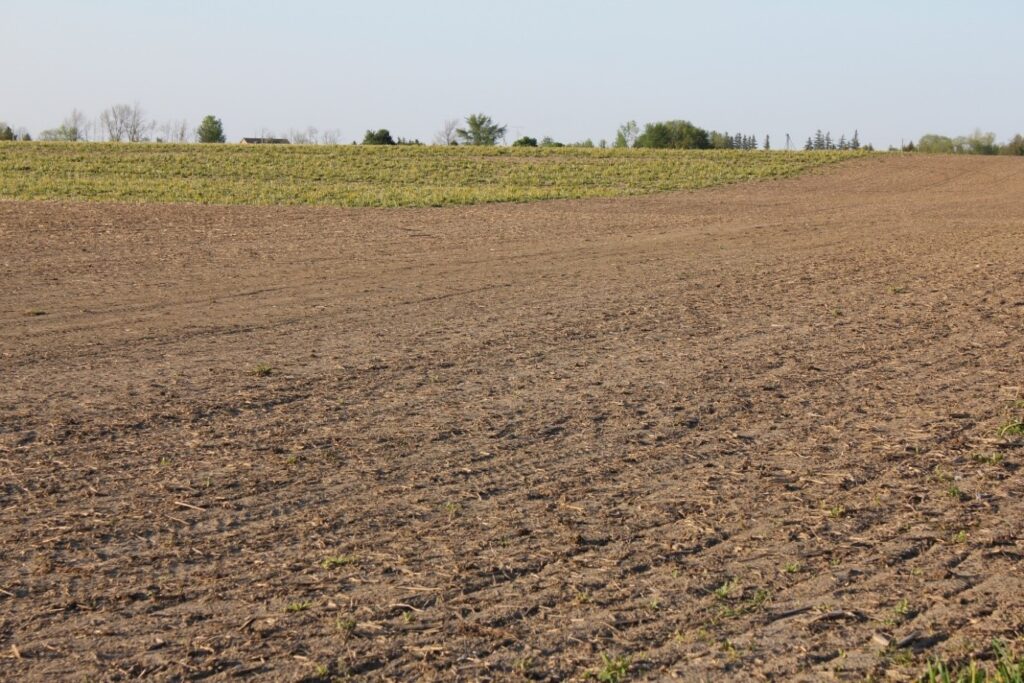
Figure 1. The headlands of this field received a fall application to control dandelions, making for a nice seed bed to plant into. The rest of the field had no fall management, and the dandelion pressure is significant and will take much longer to control now.
Table 1. Control of dandelions at four different herbicide application timings (Adapted from Franssen and Kells, 2007).
| Dandelion | Late fall | Early fall | Early spring | Late spring |
| Control (%) | 80% | 74% | 65% | 55% |
When using glyphosate to manage dandelions, if they are larger than 6” (15 cm) in diameter, a higher rate is required according to the product label. Efficacy work conducted by the University of Guelph and presented in Table 2, is consistent with the labelled guidance.
Table 2. Comparing the average and range in control of dandelion over multiple trials evaluated at eight weeks after the application of glyphosate at two rates.
| Product | Rate | Control (%) | Range (%) | # of Trials |
| Glyphosate (540 g/L) | 0.67 L/acre | 65 | 54-98 | 8 |
| Glyphosate (540 g/L) | 1.34 L/acre | 83 | 65-95 | 8 |
2) Consider fall management in winter wheat if Canada fleabane is present.
Although winter wheat yield loss from weed competition is typically small, there are exceptions. High densities of weeds that emerge with, or shortly after the crop will have the most impact on yield loss. A recent study conducted by the University of Guelph (Ridgetown Campus) found that Canada fleabane interference reduced winter wheat yield by as much as 27%. Managing Canada fleabane in the fall, improved winter wheat yields by 10-15% when compared to waiting until the spring to manage Canada fleabane (Table 3).
Table 3. Control of Canada fleabane at different application timings and impact on the yield of winter wheat (Adapted from Soltani et al., 2023).
| Product | Application Timing | Canada fleabane control (%) | Winter wheat yield (bu/acre) |
| No weed control | – | 0 | 45 |
| Infinity | Fall | 83 | 59 |
| Fall + Spring | 100 | 61 | |
| Spring | 99 | 53 | |
| Pixxaro | Fall | 97 | 61 |
| Fall + Spring | 100 | 57 | |
| Spring | 100 | 52 |
A complete list of herbicide options that are labelled for application to winter wheat in the fall can be found at the Ontario Crop Protection Hub.
3. When killing off an old stand of alfalfa with herbicides, make sure that the two-week weather forecast after application has warm air temperatures.
A study conducted at the University of Guelph (Elora Research Station) demonstrated that warm air temperatures after herbicide application, quantified by growing degree days, appeared to negatively effect the control of alfalfa. Since alfalfa has a base growing temperature of 5°C, when air temperatures following herbicide application rarely exceeded 5°C, alfalfa growth was stagnant, thereby reducing herbicide uptake and movement within the plant, and leading to unacceptable control (Table 4).
Table 4. Alfalfa control as affected by growing degree day accumulation in the two weeks following application.
| Treatment | Application Date | Growing Degree Days (14 days after application) | Alfalfa Control (%) |
| Glyphosate + 2,4-D ester | Oct 3 | 84 | 98 |
| Glyphosate + 2,4-D ester | Oct 30 | 9 | 30 |
Weather Data – Weekly September 11 – 17, 2023
| Location | Year | Highest Temp (°C) | Lowest Temp (°C) | Rain (mm) | Rain (mm) April 1st | GDD 0C April 1st | GDD 5C April 1st | CHU May 1st |
| Harrow | 2023 | 23.0 | 7.4 | 6.5 | 587 | 2867 | 2033 | 3134 |
| 2022 | 27.2 | 10.6 | 25.1 | 412 | 3052 | 2229 | 3467 | |
| 10 YR Norm (11 – 20) | 23.9 | 10.1 | 23.2 | 527 | 3094 | 2216 | 3527 | |
| Ridgetown | 2023 | 24.0 | 5.9 | 8.5 | 513 | 2736 | 1910 | 2937 |
| | 2022 | 27.8 | 9.9 | 8.0 | 285 | 2900 | 2085 | 3220 |
| | 10 YR Avg. (2011-20) | 23.9 | 8.4 | 21.8 | 479 | 2918 | 2045 | 3285 |
| London | 2023 | 22.6 | 5.6 | 16.3 | 561 | 2716 | 1892 | 2926 |
| | 2022 | 27.2 | 6.5 | 15.2 | 333 | 2820 | 2015 | 3136 |
| | 10 YR Avg. (2011-20) | 23.4 | 8.9 | 23.3 | 505 | 2888 | 2020 | 3258 |
| Brantford | 2023 | 24.3 | 4.2 | 1.1 | 446 | 2696 | 1870 | 2891 |
| | 2022 | 27.3 | 6.2 | 23.3 | 311 | 2833 | 2017 | 3075 |
| Welland | 2023 | 24.3 | 6.1 | 1.4 | 507 | 2756 | 1924 | 2982 |
| | 2022 | 25.5 | 7.4 | 15.3 | 380 | 2885 | 2060 | 3223 |
| | 10 YR Avg. (2011-20) | 24.1 | 9.2 | 16.8 | 447 | 2907 | 2038 | 3284 |
| Elora | 2023 | 22.9 | 4.4 | 33.9 | 478 | 2498 | 1689 | 2653 |
| | 2022 | 26.5 | 3.7 | 2.7 | 256 | 2605 | 1801 | 2827 |
| | 10 YR Avg. (2011-20) | 22.5 | 7.3 | 21.7 | 498 | 2610 | 1754 | 2904 |
| Mount Forest | 2023 | 21.5 | 4.7 | 11.1 | 417 | 2492 | 1688 | 2656 |
| | 2022 | 25.3 | 4.5 | 5.0 | 379 | 2596 | 1799 | 2870 |
| | 10 YR Avg. (2011-20) | 22.1 | 7.9 | 19.6 | 508 | 2601 | 1754 | 2930 |
| Peterborough | 2023 | 25.1 | 1.5 | 19.6 | 430 | 2561 | 1739 | 2686 |
| | 2022 | 24.1 | 1.8 | 18.6 | 342 | 2601 | 1783 | 2824 |
| | 10 YR Avg. (2011-20) | 23.8 | 5.0 | 13.2 | 440 | 2637 | 1780 | 2889 |
| Kemptville | 2023 | 23.5 | 5.5 | 6.4 | 516 | 2718 | 1902 | 2895 |
| | 2022 | 24.6 | 6.0 | 32.3 | 488 | 2761 | 1924 | 3041 |
| | 10 YR Avg. (2011-20) | 23.0 | 6.4 | 19.7 | 497 | 2772 | 1917 | 3094 |
| Earlton | 2023 | 22.0 | 4.2 | 20.6 | 408 | 2317 | 1548 | 2459 |
| | 2022 | 20.6 | 3.4 | 60.1 | 412 | 2333 | 1564 | 2568 |
| | 10 YR Avg. (2011-20) | 20.6 | 5.4 | 24.2 | 448 | 2262 | 1490 | 2538 |
| Sudbury | 2023 | 21.9 | 6.5 | 14.5 | 530 | 2356 | 1588 | 2527 |
| | 2022 | 22.6 | 0.0 | 27.9 | 347 | 2394 | 1617 | 2695 |
| | 10 YR Avg. (2011-20) | 20.9 | 6.3 | 31.3 | 483 | 2427 | 1633 | 2753 |
| Thunder Bay | 2023 | 21.1 | -0.6 | 4.9 | 305 | 2154 | 1407 | 2320 |
| | 2022 | 23.6 | 0.7 | 78.9 | 556 | 2129 | 1388 | 2326 |
| | 10 YR Avg. (2011-20) | 18.7 | 4.3 | 17.7 | 435 | 2177 | 1393 | 2389 |
| Fort Frances | 2023 | 18.9 | -3.1 | 1.1 | 312 | 2310 | 1556 | 2508 |
| | 2022 | 25.6 | 2.1 | 46.7 | 622 | 2217 | 1478 | 2491 |
| | 10 YR Avg. (2011-20) | 20.3 | 3.9 | 19.7 | 438 | 2303 | 1501 | 2540 |
3 thoughts on “Crop Report – Week of September 18th, 2023”
Comments are closed.