Ontario Hay Listings is a free classifieds service provided by the Ontario Forage Council. Producers looking to buy or sell hay or straw are encouraged to post an ad.
AAFC’s Agroclimate Impact Reporter is interested in how weather impacts farms throughout the growing season (i.e. what’s really happening on the ground). This ag-sector citizen science effort feeds into AgriRecovery and other programs. The monthly survey takes ~5 minutes to complete. You can join the reporter network here.
Agricorp deadlines
- September 1 – report acres for summer-seeded New Forage Seeding
- September 15 – pay premium for summer-seeded New Forage Seeding
Pests
Many areas of the province are reporting fall armyworm damage to perennial forage crops, silage corn, and forage cereals. Information on scouting and control is available here.
In 2020 there were several reports of corn rootworm injury to hybrids with below-ground protection from Bt traits. This suggests that Bt-resistant corn rootworm populations exist in Ontario. Continuous corn is at highest risk of a problem. Growers are encouraged to rotate out of corn for 2022. More information about this serious silage corn pest and how to join the corn rootworm trap network are available on Field Crop News.
Southwest
- According to AAFC, Essex, Chatham-Kent, Lambton, Elgin, and Middlesex received average or above average rainfall for August. The rest of the region had below-average amounts of precipitation for the month.
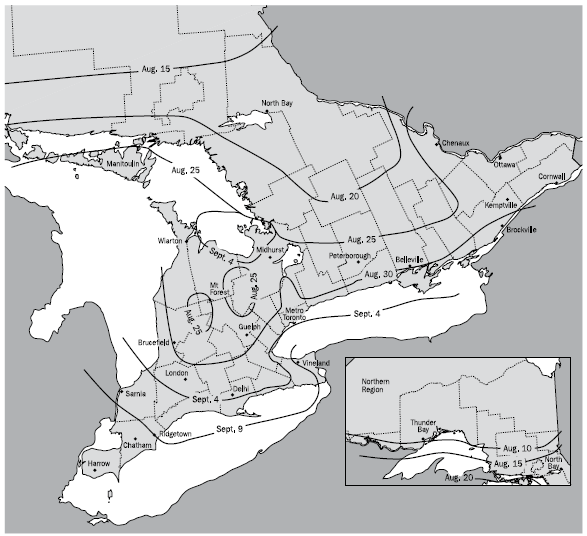
- The southern-most counties will be entering the fall rest period for alfalfa between early and mid-September. See the map for average start dates.
- Third cut on many dairy farms came off the first week of August.
Central and East
- According to AAFC, the region received below-average rainfall for August. The driest areas (<40% of average) include Northumberland, Peterborough, Kawartha Lakes, Ottawa, Renfrew, and Stormont, Dundas & Glengarry.
- Third cut on many dairy farms came off the second and third week of August.
Northeast
- According to AAFC, Algoma, Manitoulin, and Sudbury districts received average or above average rainfall for August. The rest of the region received below-average precipitation (between 40-85% of normal).
Northwest
- According to AAFC, Rainy River and Kenora districts had average rainfall for August, while Thunder Bay district was drier than normal.
- Mental Health supports are available 24/7 through Ontario 211 and the Ontario Mental Health Helpline at 1-866-531-2600.

| Location/Year | GDD 0C
March 1st (grasses) |
GDD 5C
March 1st (alfalfa) |
Precipitation (mm)
April 1st |
| Harrow | |||
| 2021 | 2865 | 2029 | 452 |
| 2020 | 2750 | 1922 | 354 |
| 2019 | 2603 | 1814 | 414 |
| Ridgetown | |||
| 2021 | 2710 | 1891 | 436 |
| 2020 | 2611 | 1805 | 383 |
| 2019 | 2464 | 1679 | 546 |
| London | |||
| 2021 | 2674 | 1869 | 351 |
| 2020 | 2531 | 1736 | 378 |
| 2019 | 2341 | 1596 | 536 |
| Brantford | |||
| 2021 | 2644 | 1835 | 315 |
| 2020 | 2552 | 1764 | 213 |
| 2019 | 2417 | 1658 | 274 |
| Welland | |||
| 2021 | 2666 | 1855 | 330 |
| 2020 | 2621 | 1809 | 292 |
| 2019 | 2490 | 1713 | 403 |
| Elora | |||
| 2021 | 2439 | 1652 | 286 |
| 2020 | 2321 | 1572 | 299 |
| 2019 | 1918 | 1247 | 417 |
| Mount Forest | |||
| 2021 | 2444 | 1666 | 401 |
| 2020 | 2295 | 1565 | 428 |
| 2019 | 2163 | 1442 | 129 |
| Peterborough | |||
| 2021 | 2433 | 1639 | 301 |
| 2020 | 2199 | 1480 | 221 |
| 2019 | 2144 | 1417 | 352 |
| Kemptville | |||
| 2021 | 2612 | 1816 | 288 |
| 2020 | 2450 | 1685 | 343 |
| 2019 | 2272 | 1543 | 203 |
| Earlton | |||
| 2021 | 2226 | 1478 | 475 |
| 2020 | 1919 | 1319 | 324 |
| 2019 | 1784 | 1159 | 363 |
| Sudbury | |||
| 2021 | 2287 | 1539 | 388 |
| 2020 | 2003 | 1372 | 417 |
| 2019 | 1835 | 1206 | 401 |
| Thunder Bay | |||
| 2021 | 2088 | 1368 | 282 |
| 2020 | 1797 | 1199 | 219 |
| 2019 | 1737 | 1095 | 322 |
| Fort Frances | |||
| 2021 | 2209 | 1466 | 253 |
| 2020 | 1967 | 1325 | 296 |
| 2019 | 1859 | 1193 | 413 |