Simple Summary
– Changes in fertilizer:corn price ratios (not fertilizer prices alone) change optimum P and K rates. Corn prices increasing with fertilizer prices can limit price ratio changes.
– Significant price ratio changes are required to appreciably change optimum P and K rates. For instance, changing fertilizer:corn price ratio ($/lb-P:$/lb-corn) in a recent Ontario P dataset from 5 to 8 (+60%) only reduced optimum P rates by 7 lb-P2O5/ac. An example of this would be corn at $6.75/bu and MAP fertilizer changing from $700/tonne to $1,100/tonne.
– Optimum P and K rates are mostly driven by yield response. Optimum rates increase as yield response increases. Soil tests are a good predictor of yield response potential. Even with price ratios in 2022 and 2023, P and K fertility decisions should likely focus more on yield response/soil test than fertilizer price.
– Based on recent Ontario data, Ontario soil test P and K recommendations for corn still do a good job identifying where responses in the year of application are likely, and how much should be applied.
– Consider practices that maximize returns on fertilizer investment (banding fertilizer, addressing other deficiencies that may limit yield responses to P and K fertilizer).
– If soil tests are in a non-responsive range (e.g. P >30 ppm, K >120ppm) and you believe fertilizer prices may decline in the future, skipping a fertilizer application for 1 or 2 years will likely have minimal impact on yield.
How Do Optimum P and K Rates Change with Fertilizer Prices?
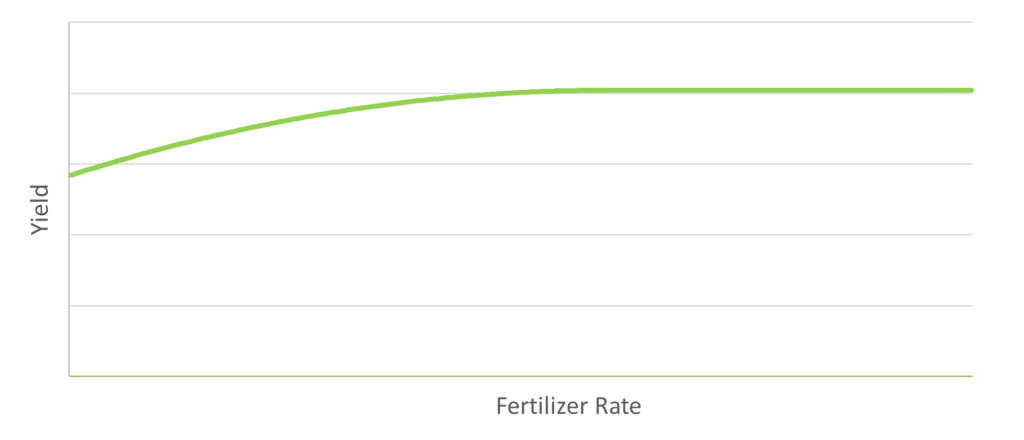
With crop nutrients, we often talk about optimum, or most economic rates. These are the rates that maximize economic returns to fertilizer. For example, using the generic fertilizer response curve in Figure 1:
- too little, and we are leaving economic yield on the table
- too much and we are applying fertilizer that is not paying us back in yield
As fertilizer prices change, so do optimum rates (Rosser, 2022b). However, changes in fertilizer:corn price ratios are what really dictate where optimum rates fall on any response curve:
- as fertilizer becomes more expensive relative to corn, optimum fertilizer rates decline
- as fertilizer becomes less expensive relative to corn, optimum fertilizer rates increase
- If both move the same relative amount, optimum fertilizer rate does not change
Significant Price Ratio Changes are Required to Move Optimum Rates
Price ratios must change significantly to move optimum fertilizer rates. For example, fertilizer:corn price ratios are included in Ontario corn N recommendations and increasing the ratio in one scenario by 50% (6.7 to 10.0) only reduced N recommendations by 10% (Rosser, 2022a) (Table 1).
Table 1. Change in nitrogen recommendations for low and high price ratio scenarios.
| 10-Year Price Scenario | Winter 2022 Price Scenario | |
| Nitrogen Price ($/lb-N) | $0.60 | $1.20 |
| Corn Price ($/bu) | $5.00 | $6.75 |
| Corn Price ($/lb) | $0.089 | $0.121 |
| Price Ratio ($/lb-N:$/lb-corn) | 6.7 | 10.0 |
| Nitrogen Recommendation (lb-N/ac) | 187 | 167 |
Fertilizer and corn prices are not incorporated into Ontario P and K recommendations, but Table 2 shows how price ratios may have changed under recent price swings.
Table 2. Change in phosphorous and potassium price ratios for long-term and recent fertilizer and corn prices.
| 10-Year Price Scenario | Winter 2022 Price Scenario | Spring 2022 Price Scenario | |
| Corn Price ($/bu) | $5.00 | $6.75 | $8.50 |
| Corn Price ($/lb) | $0.089 | $0.121 | $0.152 |
| MAP ($/tonne) | $745 | $1261 | $1261 |
| MAP ($/lb-P) | $0.65 | $1.10 | $1.10 |
| Price Ratio ($/lb-P:$/lb-corn) | 7.3 | 9.1 | 7.2 |
| Potash ($/tonne) | $515 | $1032 | $1032 |
| Potash ($/lb-K) | $0.45 | $0.90 | $0.90 |
| Price Ratio ($/lb-K:$/lb-corn) | 5.1 | 7.5 | 5.9 |
Depending on corn price, P and K fertilizer:corn price ratios have changed minimally (Spring 2022) to as much as 25-50% higher (Winter 2022). In a large Ontario P dataset (77 multi-rate P trials), changing the price ratio from 5 to 8 (+60%) only reduced optimum P rates by 7 lb-P2O5/ac on average (Janovicek et al, 2015). Reductions in optimum rates for the ratio changes in Table 2 are likely small.
What Are Optimum P and K Rates?
Yield Responses
Changes in potential yield response has a greater impact on optimum fertilizer rates than changes in prices (Deen et al, 2015; Rosser, 2022a). While a variety of factors can influence P and K yield response, the strongest factor is likely soil test:
- if soil test values are low, we expect a high probability of a high yield response, and higher rates of P and K required to maximize returns to fertilizer
- as soil tests increase, we expect the probability, yield response, and rates of fertilizer required to maximize returns to decline
- eventually we reach a point where probability of response is so low that no fertilizer is recommended
Response to P
How does optimum P rate change with soil test? This is shown in Figure 2 through:
- Ontario corn P recommendations (green line)
- optimum P rates from 77 Ontario multi-rate P trials over the past several decades (band and broadcast) (Janovicek et al, 2015)
Ontario corn P recommendations suggest:
- soil tests above 30 ppm, no P is recommended
- soil tests from 13-30 ppm, a small amount of P is recommended (18 lb-P2O5/ac)
- soil tests declining below 13 ppm, P recommendations increase linearly (45-100 lb-P2O5/ac)
Multi-rate P trial data suggest:
- optimum P rates were generally low when soil test P was above 12 ppm
- at soil tests below 12 ppm, optimum P rates increase linearly as soil test declines
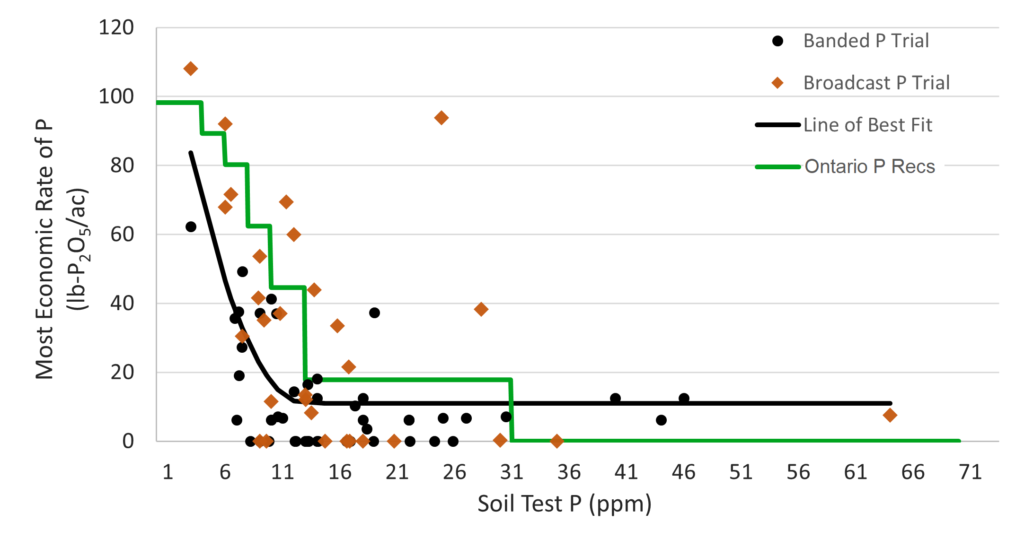
When considering yield response during the year of application, Ontario corn P recommendations do a good job identifying both soil test responsiveness, and the amount of fertilizer to be applied. Ontario P recommendations would have met fertilizer requirements at most of the multi-rate trials.
Response to K
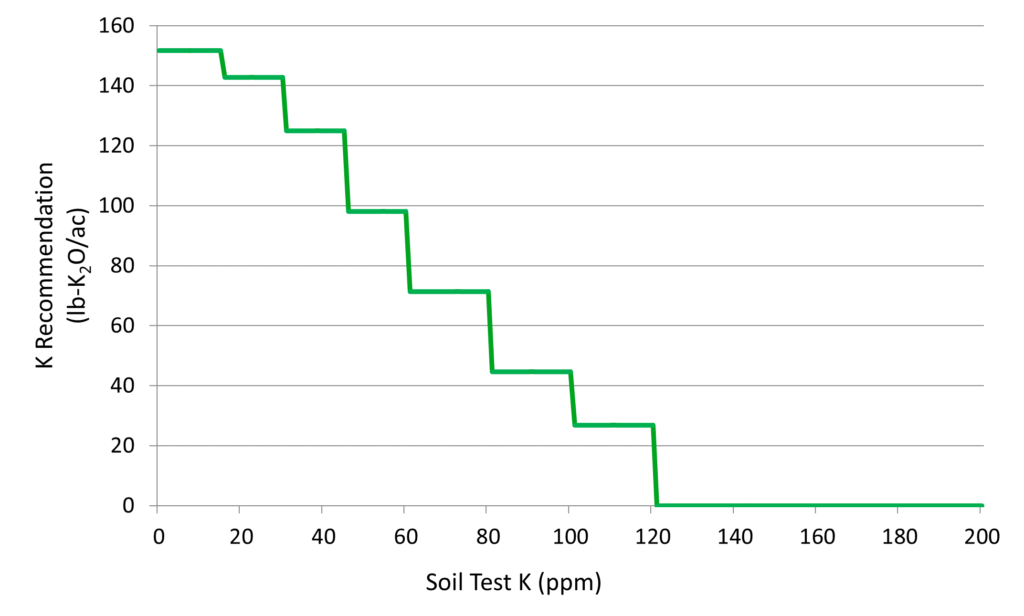
Recent Ontario multi-rate K data was not as available, but a dataset adding K to P starter fertilizer across a range of K soil tests was (Janovicek et al, 2015). Figure 3 demonstrates yield responses for adding an average of 35 lb-K2O/ac to starter P in a 2”x2” planter starter band.

Because data was not multi-rate, we can’t calculate most economic rates of K at these trials, but we can observe yield responses over soil test K. In general, economic returns to K were limited above 120 ppm but increased as soil tests declined, especially below 90 ppm. Responses by soil test level agree well with existing Ontario corn K recommendations (Figure 4).
Overall, yield responses are the strongest driver of optimum P and K rates, and soil tests are a good indicator of yield response potential. Soil tests should still be the driver for P and K decision making, as high yield responses can be expected at lower soil tests. While increases in price ratios will reduce optimum rates for any given soil test, these reductions are likely small (Rosser, 2022a). While buying expensive fertilizer is not pleasant, applications of expensive fertilizer at responsive soil tests can still provide very good returns on investment.
Soil Sampling Can Provide an Exceptional Return on Investment
For $20-30 per sample, a soil test might provide one of the greatest returns on investment on the farm. Soil tests provide guidance for when we would or would not expect economic responses to P and K fertilizers, and how much should be applied to maximize returns.
For example, from figure 2:
- if you have a field testing 6-7 ppm for soil test P and were not planning on applying P fertilizer because of high prices, it is highly likely there is economic yield being left on the table as P fertilizer can provide significant yield responses at this low of soil test.
- If you have a field testing 35 ppm for P, we expect probability of yield response to be exceptionally low, and unlikely to cover the cost of that fertilizer… a fertilizer application could likely be skipped.
Without soil test information, or even better, data comparing fertilizer P and K applications on-farm, it could be difficult to know what response probability might be in a field.
Maximize Your Return on Fertilizer Investment
There are practices that can ensure we get the most out of fertilizer dollars spent. For example:
- planter banding some amount of P and K fertilizer instead of relying solely on broadcast can be much more efficient for yield response, especially on low testing soils (Table 2)
Table 3. Average grain corn yield and profit increase in response to broadcast and banded phosphate (Brown, 2017).
| Application Method | Yield Increase | Profit Increase |
| Broadcast | +3.5 bu/ac | -$19/ac |
| Banded | +9.7 bu/ac | +$9/ac |
- ensure you are not ignoring other fertility needs
- for example, Ontario research demonstrates that returns to fertilizer P on low K testing soils can be limited until K deficiencies are addressed.
To Maintain or Not to Maintain?
What do you do if you are in a non-responsive soil test range (e.g. over 30 ppm for P, over 120 ppm for K) but normally apply some P and K fertilizer to maintain soil tests? If you believe P and K fertilizer prices could go down in the future, you could likely skip an application for a year or two. As shown in figures 2 and 3, we would expect a very low probability of yield response to P and K, especially if only broadcast.
Acknowledgements
Thanks to Ken Janovicek, University of Guelph Research Associate, for providing supporting data, and to Colin Elgie, OMAFRA Soil Fertility Specialist, for review and comments on this article.
References
Brown, C (editor). 2017. Agronomy Guide for Field Crops Publication 811. Queen’s Printer for Ontario.
Deen, B., K. Janovicek, J. Lauzon and T. Bruulsema. 2015. Optimal rates for corn nitrogen depend more on weather than price. Better Crops. 99:16-18.
Janovicek, K., B. Rosser and G. Stewart. 2015. An Ontario P+K Database to Affirm and Update BMP’s in Field Crop Production Systems. University of Guelph and Ontario Ministry of Agriculture, Food and Rural Affairs.
Rosser, B. 2022a. How Low Should You Go? Adjusting Corn Nitrogen Rates for High Fertilizer Prices. FieldCropNews.com. https://fieldcropnews.com/2022/03/how-low-should-you-go-adjusting-corn-nitrogen-rates-for-high-fertilizer-prices/. (accessed 25 Apr. 2022).
Rosser, B. 2022b. Understanding MERN (Most Economic Rate of Nitrogen) for Corn. FieldCropNews.com. https://fieldcropnews.com/2022/04/understanding-mern-most-economic-rate-of-nitrogen-for-corn/. (accessed 25 Apr. 2022).